Northern and Southern Hemisphere Warming
By Andy May – March 13, 2022
It is common for the news media and consensus scientists to report global average surface temperatures without mentioning that both the warming rate and average temperatures vary a lot around the Earth over one year. For example, Earth’s global average surface temperature varies about 7° F every year. The rate also varies by hemisphere. Phil Jones and colleagues show that the global average monthly temperature, from 1961-1990, was about 54° F in January and 61° F in July. In the Northern Hemisphere it varied from 46° F in January to 70° F in July, the respective average temperatures in the Southern Hemisphere are 61° F and 51° F.
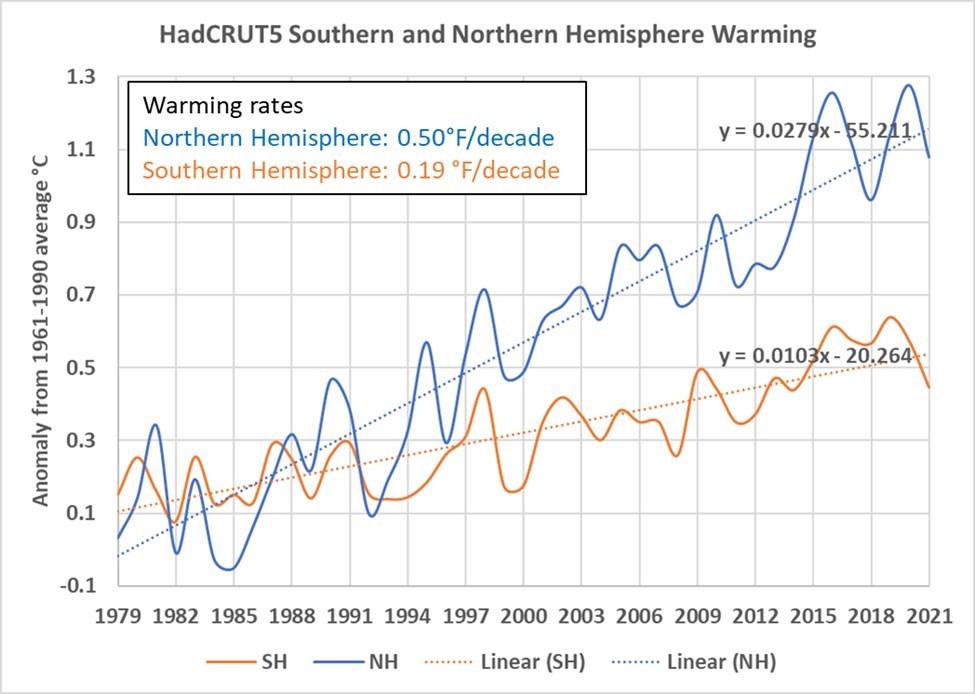
Figure 1. HadCRUT 5 hemispheric temperature records. Anomalies from the 1961-1990 average. Data source: (Met Office Hadley Centre datasets, 2022).
As shown in Figure 1, the Hadley Climatic Research Unit HadCRUT5 temperature dataset suggests the Northern Hemisphere warmed 0.74°C (1.3° F) more than the Southern Hemisphere from 1979 through 2021. The UAH satellite temperature lower troposphere record is directionally similar but the difference between the hemispheres is much less, as shown in Figure 2, both figures have identical vertical scales of 1.4°C. The UAH global satellite warming rate difference between the hemispheres is about 0.2°C (0.4° F), less by more than a factor of 3.
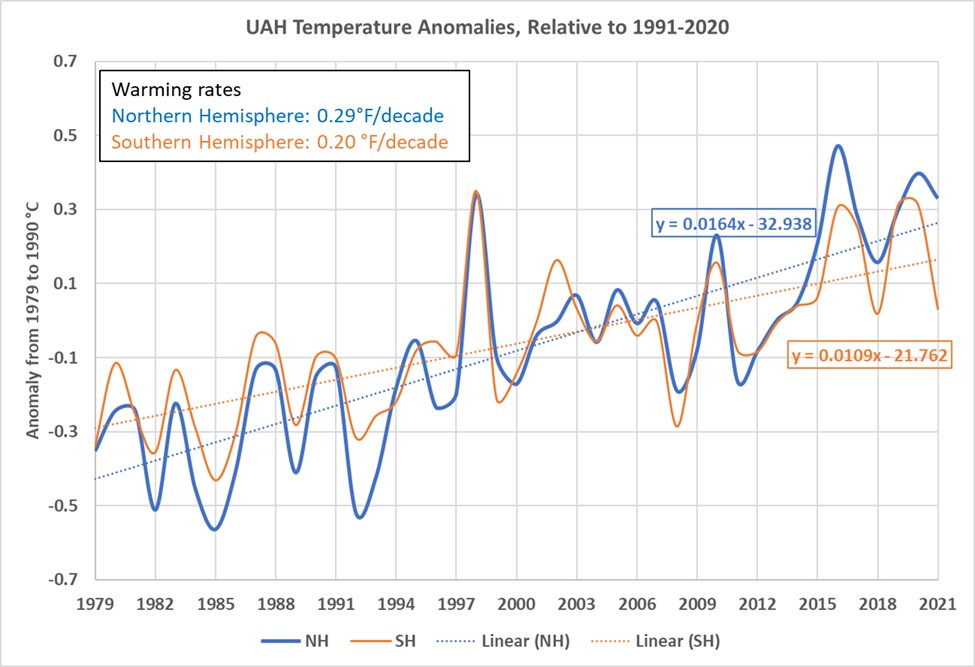
Figure 2. The UAH satellite lower troposphere temperature records for the Northern and Southern Hemispheres. The difference is much less than the HadCRUT5 difference. Both Figure 1 and Figure 2 have a vertical scale of 1.4°C or 2.5°F. Data source: Dr. Roy Spencer.
The UAH and HadCRUT5 Southern Hemisphere warming rates are nearly identical, both are roughly 0.2 F per decade. But the Northern Hemisphere rates are very different, the HadCRUT5 rate is about 0.5 degrees F per decade and the UAH rate is 0.29 degrees F per decade. The HadCRUT5 Northern Hemisphere rate is a whopping 72% more than the UAH satellite rate. In the Southern Hemisphere the UAH warming rate is slightly larger than the HadCRUT5 rate, but the difference is very small, only 5%, and probably not significant. But 72% is certainly significant.
A difference in hemispheric warming rates is characteristic of solar and orbital forcing due to the tilt of Earth’s axis relative to the orbital plane combined with Earth’s rotation. It is not characteristic of forcing due to a well-mixed greenhouse gas, like CO2. The large Northern Hemisphere HadCRUT5 warming rate is suspicious.
About 68% of Earth’s land area is in the Northern Hemisphere, and the HadCRUT5 surface temperature record is a combination of two very different datasets. The HadSST4 sea surface temperature dataset measures the temperature at an ocean depth of about one foot and the CRUTEM5 land-surface dataset measures air temperature at an altitude of about six feet. The UAH satellite dataset is a lower troposphere dataset, and measures air temperature at about 10,000 feet, the measurements are all made using the same satellite data.
It is possible that the urban heat island effect,[i] combined with the UK Hadley Centre “homogenization” algorithm has contaminated the land-only CRUTEM5 record and distorted it.[ii] Because land surface temperatures are often highly variable over short distances there is a need to “homogenize” or smooth them to get mappable values. One of the large differences is between cities and rural weather stations, since cities are warmer than the surrounding countryside due to pavement, cars, air conditioners, etc. This difference is called the urban heat island effect.
If we look at the whole HadCRUT5 hemispheric record, the difference in rates shown in Figure 1 looks even more suspicious, as shown in Figure 3. The very large difference between the hemispheres is not seen in the earlier years of the HadCRUT5 record.
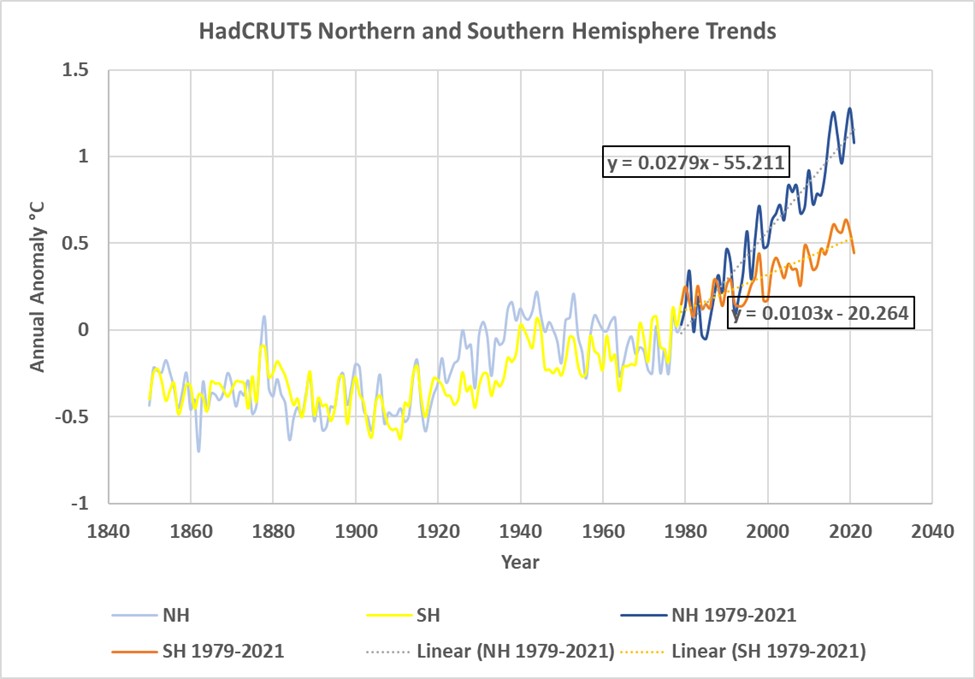
Figure 3. The total HadCRUT5 hemispheric temperature records.
Conclusions
The UAH and HadCRUT5 records both show the Northern Hemisphere warming more rapidly than the Southern, but the amount of extra warming in the HadCRUT5 record is very anomalous. While the Southern Hemisphere satellite and surface rates are similar, the Northern Hemisphere rates are very different.
The global UAH lower troposphere and HadSST4 warming rates are both 0.14°C/decade from 1979 to 2020, the same to two decimals. The oceans cover 70% of Earth’s surface and the HadSST4 dataset is used in combination with the CRUTEM5 land-surface temperature record to produce the curves in Figure 1. Given this, the large difference in Northern Hemisphere warming rates between Figures 1 and 2 is very hard to explain. Frankly, it suggests there is a problem with CRUTEM5. This topic is discussed in more detail in my latest book: The Great Climate Change Debate: Karoly v Happer.
The bibliography can be downloaded here.
[i] The Urban Heat Island effect is the result of humans paving over land and replacing transpiring trees and plants that have a natural cooling effect. Humans also have heat generating air conditioners, factories, and vehicles. Cities can be up to 7 degrees warmer than the surrounding countryside. https://climate.mit.edu/explainers/urban-heat-islands
[ii] (Scafetta, 2021) explains how the urban heat island corrupts the global surface temperature record. https://link.springer.com/article/10.1007/s00382-021-05626-x
(Jones, New, Parker, Martin, & Rigor, 1999) https://agupubs.onlinelibrary.wiley.com/doi/10.1029/1999RG900002
Andy May is a petrophysicist, paleoclimate expert, member of the CO2 Coalition, and author of four books on climate and Kansas history. His latest is The Great Climate Debate: Karoly vs. Happer.