Fossil Fuels are the Greenest Energy Sources
Indur M. Goklany – August 30, 2022
Contrary to the claims of proponents of the Green New Deal and Net Zero, fossil fuels are the greenest fuels.
First, uniquely among energy sources, fossil fuel use emits CO2, which is the ultimate source of the elemental building block, carbon, found in all carbon-based life, i.e., virtually all life on Earth.
The increased amplitude of the seasonal cycle in atmospheric CO2 and satellite-borne instrumentation to measure solar-induced chlorophyll fluorescence from plants provide direct evidence that global photosynthetic activity (or Gross Primary Production, GPP, a measure of the change in global biomass) has increased over the past several decades (Frankenberg et al. 2011; Graven et al. 2013). Observed variations (Campbell et al. 2017) of atmospheric CO2 over the past two centuries are consistent with increasing primary productivity. Other satellite studies also show that the earth has been greening continually in recent decades (Zhu et al. 2016; Piao et al. 2020). Second, fossil fuel dependent technologies have increased agricultural yields directly or indirectly by at least 167% (Goklany 2021). This increase in agricultural productivity is due to the use of fossil-fuel-dependent technologies, specifically, nitrogen fertilizers, pesticides and carbon dioxide fertilization resulting from fossil fuel emissions. This has enabled human beings to meet their demands for food using less cropland, which then spares land for the rest of nature. Thus, in the absence of fossil fuels, at least 167% more land would have to be cultivated to maintain global food production at current levels. That would be equivalent to increasing current cropland from 12.2% of global land area (GLA) (FAO 2019) to 32.7%. But diversion of habitat (land) to agriculture is already deemed to be the greatest threat to global biodiversity. Fossil fuels have, therefore, not only increased productivity of already-converted habitat, they have forestalled conversion of at least an additional 20.4% of GLA.
Consequently, the world sustains 10 times more people today (7.97 billion) than at the start of the Industrial Revolution (786 million in 1750), while supporting more biomass.
Moreover, to compare the impacts of the various energy options on habitat, we should consider the physical footprint needed to produce an equivalent amount of energy via each option (solar, wind and the various fossil fuels). Second, for wind and solar to be viable substitutes for fossil fuel energy, they should be coupled with batteries to solve their intermittency problem which requires substantial amounts of metals and other materials that must be mined, smelted and refined which necessarily would disturb the land.
The Greening of the Earth and the Increase in Biomass
Based on satellite data, Zhu et al. (2016) found that from 1982–2009, 25–50% of global vegetated area had become greener while 4% had become browner. They attributed 70% of the greening to CO2 fertilization from emissions from fossil fuel combustion (which increases photosynthesis and water use efficiency, WUE, of most vegetation), 9% to nitrogen deposition (also from the use of fossil-fuel-derived fertilizers), 8% to climate change, and 4% to land use change. The first three, responsible cumulatively for 87% of the greening, are related to the use of fossil fuels.
Chen et al. (2019) report that global leaf area increased by 5.4 million km2 over 2000–2017, equivalent to the area of the Amazon rainforest (Piao et al. 2020). They noted, per MODIS data, that 34% of the globe is greening while 5% is browning. Leaf area increased at the rate of 2.3% per decade from 2000‒2017. China and India accounted for 25% and 6.8% of the global net increase in leaf area despite only having 6.6% and 2.7% of global vegetated area, respectively. Greening occurred mainly in forests and croplands in China, and croplands (82%) in India, suggesting that greening is from reforestation and agricultural practices (e.g., fertilizers and multi-cropping).
Song et al. (2018) found that, contrary to prevailing wisdom, global tree cover increased by 2.24 million km2 (+7.1%) from 1982–2016. A net loss in the tropics was outgained by increases in the extratropics. Global bare ground cover decreased by 1.16 million km2 (−3.1%), most notably in agricultural regions in Asia. 60% of all land use/cover changes were associated with direct human activities and 40% with indirect factors such as climate change, which indicates net reforestation and net de-desertification over the study period, partly attributed to climate change. Reforestation was probably enabled by increased productivity of agricultural lands substantially due to the use of fossil-fuel-derived fertilizers and pesticides, and increases in CO2 fertilization (indirectly from using fossil fuels). Together, they rendered land surplus to agricultural needs.
Using data from 1982-2011, Gao et al. (2019: 9) found that productivity, using annual maximum Normalized Difference Vegetation Index (NDVI) as a proxy, increased significantly in 45.8% of global grasslands while declining significantly in 1.5%.
Using data from 1982-2011, Cheng et al. (2017) found that global gross primary productivity (GPP) increased, mainly due to increased WUE of vegetation, an expected, but underemphasized, consequence of increasing CO2 concentrations. Despite large-scale occurrence of droughts and disturbances over the study period, annual GPP increased 0.6 ± 0.2% per year. About 65% of vegetated land showed significant positive trends in GPP. Ecosystem WUE also increased significantly in 78% of vegetated areas.
In a review article on global greening drawing upon the above studies, among others, Piao et al. (2020) note that:
“Greening is pronounced over intensively farmed or afforested areas, such as in China and India, reflecting human activities. However, strong greening also occurs in biomes with low human footprint, such as the Arctic, where global change drivers play a dominant role. Vegetation models suggest that CO2 fertilization is the main driver of greening on the global scale, with other factors being notable at the regional scale.”
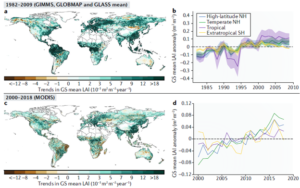
Satellite-derived empirical trends in greening from 1982 to 2018, using the mean growing season (GS) leaf area index (LAI) as a surrogate, are shown in Figure 1 (Piao et al. 2020).

Figure 1. Changes in mean growing season (GS) leaf area index (LAI) based on empirical satellite-derived data. (a) Based on changes in Advanced Very- High-Resolution Radiometer (AVHRR) LAI from 1982–2009. The AVHRR LAI dataset is the average of three sets of satellite data products (GIMMS13, GLOBMAP23 and GL ASS192). (b) Based on changes over four regions from 1982–2009. (c) Based on changes in Moderate Resolution Imaging Spectroradiometer (MODIS) LAI from 2000–2018. (d) Based on changes in MODIS LAI over four regions during 2000–2018. Source: Piao et al.2020.
Finally, Sun et al. (2020) estimated that GPP increased at the rate of 0.16% per year from 2000 to 2014 largely due to CO2 fertilization. Combining this estimate with Campbell at al.’s estimate of a 31% increase in GPP during the 20th century, gives a cumulative increase of 34% from 1900 to 2014.
The increased productivity from higher photosynthetic rates and WUE due to higher CO2 concentrations implies the biosphere produces more plant matter, i.e., more food for all carbon-based organisms even under water-stressed conditions, which further enables earth to sustain higher biomass, that is, more organisms and/or a larger variety of species while also increasing its resiliency to drought, a chronic condition detrimental to most life forms (but which may favor drought-tolerant species).
Habitat Saved by Fossil Fuel Usage from Conversion to Human Use
Use of fossil fuel technologies has enabled human beings to spare 20.4% of GLA for the rest of nature. This exceeds both the habitat lost currently to cropland (12.2% of GLA) and the global cumulative area currently reserved or identified as conservation areas (estimated at 14.6% of GLA) (Goklany 2021). Clearly, conversion of this magnitude of habitat to agriculture would devastate global biodiversity.
The increased agricultural productivity allowed cropland in many areas to revert to forest or other non-agricultural use. For example, between 1990 and 2020 forestland in the USA and Western Europe increased 2.4% and 10.1% despite population increases of 30% and 11%, respectively (FAOSTAT 2022).
Physical Footprint of Various Electrical Generating Facilities
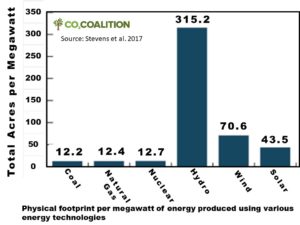
Different energy sources have different demands on land. Figure 2 compares the physical footprint needed to site a 1 MW power plant using different energy sources. The estimates shown include direct and indirect land requirements based on U.S. practices as of 2015. They include estimates of land used during resource production, for transport and transmission lines, and store waste materials. Both one-time and continuous land-use requirements were considered (Stevens et al. 2017).

Figure 2. Physical footprint per megawatt of energy produced using various energy technologies, based on practices as of 2015. (Source: Stevens et al. 2017)
Figure 2 shows that compared to fossil fuels, solar would need more than three times as much land; wind, five times as much; and hydropower, 25 times as much.
Land Needed for “Clean” and Fossil Fuel Energy Systems
To replace fossil fuel and nuclear generation, wind and solar would need to be coupled, at a minimum, with battery backup to provide electricity round-the-clock. However, the manufacture of batteries, as well as solar panels and wind turbines involves relatively vast quantities of metals and minerals. This necessarily entails equally vast mining operations and land disturbance.
Although, the amount of mining would no doubt increase, the estimated global areal extent of mining operations is very small relative to agricultural operations (5.7 million hectares vs. almost 5 billion hectares, about one-third of which is cropland and the remainder, pastureland and meadow for livestock) (Maus 2020, FAO 2019). Thus, the additional amount of surface disturbance may be relatively minor. This is because while agriculture depends substantially on the energy harvested from the sun which is a function of the surface area occupied by the array of solar panels or windmills, mining involves the excavation and processing (including transportation, smelting, and refining) of vast quantities of material (volume operations). Nevertheless, these operations themselves require substantial energy consumption and emit significant amounts of air and water pollution.
The International Energy Agency (2022) notes that solar and wind powered energy systems typically require more metals and minerals than their fossil fueled analogs. For instance, it notes that a typical electric vehicle requires six times the mineral inputs of a conventional car and an onshore wind plant requires nine times more mineral resources than a natural gas-fired power plant, while offshore wind plants require fifteen times as much as natural gas.
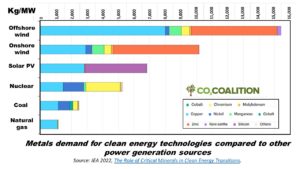
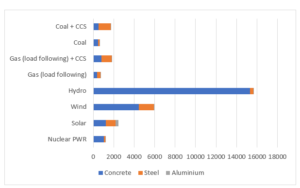
Figure 3 shows the demand estimated by the International Energy Agency for various metals to generate 1 MW of power using different energy technologies (IEA 2022). It shows that demand for these metals is substantially larger for renewable energy technologies. However, this figure excludes demand for concrete and cement, steel and aluminum. The demand for those materials is shown in Figure 4 (in tonnes per TWh of electricity generated).

Figure 3. Metals demand for clean energy technologies compared to other power generation sources. Note: Steel and aluminum are not included. The values for offshore wind and onshore wind are based on the direct-drive permanent magnet synchronous generator system (including array cables) and the doubly-fed induction generator system respectively. The values for coal and natural gas are based on ultra-supercritical plants and combined-cycle gas turbines. Actual consumption can vary by project depending on technology choice, project size and installation environment. Note: Lithium demand is included in the “rare earths” category. Source: IEA 2022, The Role of Critical Minerals in Clean Energy Transitions.
We see from Figure 3 that fossil fuels (natural gas and coal, in that order) have substantially lower demand for metals (and, therefore, associated land disruption), followed by nuclear, solar and, finally, wind. [Metals demand for hydropower was not provided in the IEA report.]

Figure 4. Demand for concrete, steel and aluminum (in tonnes per TWh) for different energy technologies. Source: World Nuclear Association 2022). Note: Carbon Capture and Storage (CCS) in combination with coal and gas are included although CCS is not generally economically viable.
Figure 4 shows that fossil fuels and nuclear have the lowest total demand for concrete, steel and aluminum, followed by solar, wind and hydroelectric (in that order). Once again, we see that land disturbance would be substantially greater for renewables than for fossil fuel and nuclear.
Figure 4 also includes demand for concrete, aluminum and steel for plants that may use carbon capture and storage (CCS) in combination with coal and gas although CCS has not been proven to be economically viable even in special circumstances where the CCS product can be used in captive facilities, e.g., for enhanced oil recovery. Notably, the advantage of coal and gas over nuclear (regarding demand for these three materials) disappears if CCS is employed. However, it should also be noted that economic viability does not seem to constrain policymakers nowadays.
Conclusion
Fossil fuel combustion has increased the amount of carbon dioxide available to green the earth. This has contributed the major share of the approximately 34% increase in the earth’s GPP that has occurred since 1900 that has literally greened the earth. Second, by enhancing agricultural productivity, fossil fuel-dependent technologies have forestalled the conversion of at least 20.4% of global land area to agricultural uses. This is 25% larger than the entire area of North America. Remarkably, this exceeds the total amount of land currently set aside globally for both cropland (12.2%) and conservation worldwide (14.6%). Third, relative to renewable energy sources, fossil fuels have smaller physical footprints and lower demand for metals and other minerals. The latter substantially limits mining and other land disturbance. Such disturbance would inevitably result in “browning” of the land. Hence, fossil fuels are indeed the greenest energy sources. But “greenest” does not necessarily mean the “cleanest”. That distinction may have to be reserved for nuclear energy, but that is another topic.
Acknowledgments
My thanks to Drs. Will Happer and Greg Wrightstone for their incisive and constructive comments, which have resulted in a much-improved paper. Any flaws and omissions, however, are my responsibility.
References
Campbell JE, Berry JA, Seibt U, Smith SJ, Montzka SA, Launois T, Belviso S, Bopp L, Laine M. Large historical growth in global terrestrial gross primary production. Nature. 2017 Apr;544(7648):84-7.
Chen, C. et al. China and India lead in greening of the world through land- use management. Nat. Sustain. 2, 122–129 (2019a).
Cheng, Lei, Lu Zhang, Ying-Ping Wang, Josep G. Canadell, Francis HS Chiew, Jason Beringer, Longhui Li, Diego G. Miralles, Shilong Piao, and Yongqiang Zhang. 2017. Recent increases in terrestrial carbon uptake at little cost to the water cycle. Nature Communications, 8(1): 110.
Forkel M, Carvalhais N, Rödenbeck C, Keeling R, Heimann M, Thonicke K, Zaehle S, Reichstein M. Enhanced seasonal CO2 exchange caused by amplified plant productivity in northern ecosystems. Science. 2016 Feb 12;351(6274):696-9.
Frankenberg C, Fisher JB, Worden J, Badgley G, Saatchi SS, Lee JE, Toon GC, Butz A, Jung M, Kuze A, Yokota T. New global observations of the terrestrial carbon cycle from GOSAT: Patterns of plant fluorescence with gross primary productivity. Geophysical Research Letters. 2011 Sep;38(17).
Gao, Qingzhu, Mark Schwartz, Wenquan Zhu, Yunfan Wan, Xiaobo Qin, Xin Ma, Shuo Liu, Matthew Williamson, Casey Peters, and Yue Li. 2016. Changes in global grassland productivity during 1982 to 2011 attributable to climatic factors. Remote Sensing, 8(5): 384.
Goklany IM. Reduction in global habitat loss from fossil‐fuel‐dependent increases in cropland productivity. Conservation Biology. 2021 Jun;35(3):766-74.
Graven HD, Keeling RF, Piper SC, Patra PK, Stephens BB, Wofsy SC, Welp LR, Sweeney C, Tans PP, Kelley JJ, Daube BC. Enhanced seasonal exchange of CO2 by northern ecosystems since 1960. Science. 2013 Sep 6;341(6150):1085-9.
International Energy Agency 2022. The Role of Critical World Energy Outlook Special Report Minerals in Clean Energy Transitions.
Maus V, Giljum S, Gutschlhofer J, da Silva DM, Probst M, Gass SL, Luckeneder S, Lieber M, McCallum I. A global-scale data set of mining areas. Scientific data. 2020 Sep 8;7(1):1-3.
Piao S, Wang X, Park T, Chen C, Lian XU, He Y, Bjerke JW, Chen A, Ciais P, Tømmervik H, Nemani RR. Characteristics, drivers and feedbacks of global greening. Nature Reviews Earth & Environment. 2020 Jan;1(1):14-27.
Song, Xiao-Peng, Matthew C. Hansen, Stephen V. Stehman, Peter V. Potapov, Alexandra Tyukavina, Eric F. Vermote, and John R. Townshend. 2018. Global land change from 1982 to 2016. Nature, 560(7720): 639.
Stevens, Landon et al. 2017. The Footprint of Energy: Land Use Of U.S. Electricity Production. Strata. Available at https://docs.wind-watch.org/US-footprints-Strata-2017.pdf.
Zhu, Zaichun, Shilong Piao, Ranga B. Myneni, Mengtian Huang, Zhenzhong Zeng, Josep G. Canadell, Philippe Ciais et al. 2016. Greening of the Earth and its drivers. Nature climate change 6(8): 791.
Authored by Indur M. Goklany
Indur Goklany is a Member of the CO2 Coalition. He is an author, researcher, and longtime civil servant. He became involved with the Intergovernmental Panel on Climate Change since before its inception. His degrees are PhD and MS (Electrical Engineering and Systems Science) and Bachelor of Technology (Electrical Engineering).
![]()

