Climate Change, the Greatest Con Job Ever (U.N. Speech by Trump)
Hiroshi L. Tanaka
Professor Emeritus, University of Tsukuba
International Environment and Economy Institute (IEEI)
October 17, 2025
- Global warming is a hoax
In his presentation at the General Assembly of United Nations on September 23, 2025, President Trump stated, “Global warming is a hoax ” and that climate change policy is “The greatest con job ever.” He justified his decision to withdraw from the Paris Accord, arguing, “If you don’t withdraw from this green scam, your country is going to fail.” During the U.N. General Assembly, President Trump faced a series of harassing incidents, including an escalator he and his wife boarded suddenly stopping, and the teleprompter he used for his speech not working. As a result, his 15-minute speech was extended to an hour, allowing us to hear a bunch of Trump’s thoughts on net-zero carbon policy.
When President Trump says, “global warming is a hoax,” many viewers will think he’s a crazy president who ignores science. However, this phrase is quite clever and accurate. The United Nations Framework Convention on Climate Change defines global warming as warming caused by an increased anthropogenic greenhouse gas. Therefore, by definition, “global warming is a hoax”
because most of it is due to natural variability as he thinks while global-mean temperature has certainly increased in recent years. Here, natural variability refers to changes in geophysical fluids that occur even the absence of anthropogenic CO2. Recently, the term “climate change” has come to be used instead of “global warming,” implying that natural variability is always included in observed warming.
The IPCC (Intergovernmental Panel on Climate Change) has stated that there is “no doubt” that recent warming is anthropogenic. It implies that natural variability accounts for only 10% or less of the total. In contrast, skeptics believe that recent warming is mostly due to natural variability, and the influence of anthropogenic CO2 may be negligible. This is where the different perception lies between President Trump and IPCC. However, separating the causes of global warming into natural and anthropogenic variability is extremely difficult, and nobody knows the exact proportions.
The Trump administration completely rejected the Biden administration’s “Green New Deal” energy policy, which prioritized net-zero emission. He called for plentiful, inexpensive fossil fuels to “drill, baby, drill,” and has made a major shift toward a new policy of “energy dominance” to achieve economic growth and national security.
In Japan, the Sanse Party and the Japanese Conservative Party have aligned with President Trump’s policies, while all other parties, including the Liberal Democratic Party, are following Biden’s net-zero policy. The reason for this is the IPCC’s 1.5 deg C goal. Environmental NGOs are threatening people that if global warming continues at its current rate, it will exceed a tipping point of no return, leading to runaway warming and an uncontrollable scorching hell. However, approximately 200 million years ago, when dinosaurs flourished, temperatures were 13 deg C higher than today, yet there was no runaway warming. The argument that global warming will run away if it exceeds 1.5 deg C is a threat. Therefore, for President Trump to achieve “energy dominance,” he needs to show scientific evidence and legal reform to convince these concerns.
As a first step in his decarbonization bill, Secretary of Energy Chris Wright is attempting to revoke the 2009 Environmental Protection Agency’s ” Endangerment Finding” of CO2 as a harmful gas. As scientific evidence, he published the Climate Working Group report, “A Critical Assessment of the Impact of Greenhouse Gas Emissions on the U.S. Climate,” by five prominent scientists. Environmental Protection Secretary Lee Zeldin said this would be “the largest deregulation in U.S. history” and would have an economic impact of $1 trillion (approximately ¥150 trillion). Japan should follow this in the same way by abolish the government’s decarbonization plan, which calls for ¥150 trillion in Green Transformation (GX) investments over 10 years, thereby achieving a deregulation impact of ¥150 trillion.
The IPCC has stated that there is now “no doubt” that recent global warming is caused by human activity. Decarbonization is a global trend and, under the guise of the SDGs, has become a central issue in international politics. Failure to achieve the IPCC’s 1.5 deg C goal incites fear that we will fall into a scorching hell, brainwashing people from an early age. This perception, which 97% of scientists apparently believe, needs to be reversed. For President Trump to push forward with his decarbonization policy, he needs to scientifically demonstrate that recent global warming is the result of natural variability and not an increase in CO2.
Environmental protection laws have been enacted, and extra-legal funding is being provided for renewable energy investments and the spread of Electric Vehicles under the net-zero policy. This system, in which politicians, media, academia, and corporations benefit from tax money, is a true global warming deep state, and it will not be easy to dismantle it. Some are making a big money. However, President Trump is trying to make this policy reverse. To help with this, this article introduces scientific research suggesting that most of the recent global warming is due to natural variability.
- Most of global warming is due to natural variability
Around the time the IPCC was established in 1988, the author attended the first CSMI (Climate System Modeling Initiative) workshop at NCAR in Colorado, representing the Atmospheric Division of the Geophysical Institute, University of Alaska Fairbanks. With the end of the Cold War, huge government budgets were shifting to the new issue of global warming. A brochure with a satellite image of the Earth’s clouds was distributed with the words “Global Change” on its cover. The conference discussed research strategies using climate models, and a plan was announced to increase the budget from $133.9 billion in 1989 to $190.5 billion in 1990.
A comparison of 12 climate models under development at the time revealed that while climate values were consistent based on clear-sky radiation processes, they diverged significantly when cloud radiation processes were introduced. It was confirmed that issues such as cloud radiation process in climate models should be resolved and that further efforts should be made to develop climate models predicting next five to fifty years. This marked the beginning of the climate model development and model-intercomparison project (MIP) that forms the backbone of the IPCC.
In 1997, the International Arctic Research Center (IARC) was established on the campus of the University of Alaska with joint funding from Japan and the United States. Professor Shun-Ichi Akasofu, Director of the Geophysical Institute, became IARC’s first Director. The Arctic was warming twice as fast as the global average. A consensus had emerged that the Arctic ice-albedo feedback was amplifying CO2-induced warming. Research budgets were allocated on the premise that anthropogenic increases in CO2 were causing global warming, and IARC was established as part of this process. While budgets were allocated for observational research, future projections using climate models were promoted using cutting-edge supercomputers. The first challenge was to use climate models to reproduce the reality of Arctic warming twice as fast as the global average.
Akasofu led two Wadachi International Conferences on Arctic Warming, one in 1995 and the other in 2001, and seven subsequent conferences GCCA (Global Change Connection to the Arctic). The author was a young member of Akasofu’s global warming research team. While climate research was advancing through international collaboration, the Climate Gate scandal occurred in 2009, raising skepticism. Mike Mann’s hockey stick diagram, featured as the centerpiece of the IPCC-AR3 report, drew mixed reviews.
Around that time, Akasofu, who had been actively campaigning for more funding for Arctic warming research, began arguing that warming should be caused by natural variability rather than CO2, and became one of the leading skeptics. At a U.S. Congressional hearing, Akasofu noted the discrepancy between the spatial distribution of warming observed and climate models, explaining his distrust of model projections.
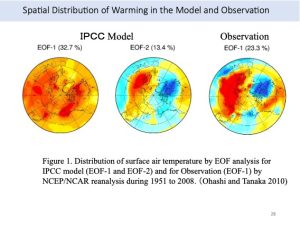
In response to this, in 2010, the author published a paper presenting the results of a principal component analysis of Arctic warming (Ohashi and Tanaka 2010). Global warming progressed rapidly from the 1970s to the 2000s, and the first principal component of the observed temperature data showed a pattern of warming in Siberia and North America and cooling in Greenland (Figure 1, right). This is a natural variation pattern known as Arctic Oscillation, which is author’s specialty. Meanwhile, the first principal component of the temperature data from simulation experiments using climate models showed an ice-albedo feedback pattern of uniform warming in the Arctic (Figure 1, left). Then, the second principal component showed the same Arctic Oscillation pattern as the observed data (Figure 1, center).
In fact, this result is significantly important. While the rapid warming in the real atmosphere from 1970 to 2000 was caused by Arctic Oscillation, a natural variability, climate models reproduced this rapid warming by tuning it into the ice-albedo feedback caused by anthropogenic increases in CO2. This evidence demonstrates a fundamental flaw: climate models reproduce warming caused by natural variability through the greenhouse effect of CO2. The latest climate models are sophisticated enough that such discrepancies may not be visible, but they are intrinsic characteristics of the original climate models.
Comparing the warming measured by John Christie’s satellite observations with climate model predictions, the satellite measurements show a warming hiatus that stagnated for 15 years from 2000. Meanwhile, climate models overestimate global warming, resulting in significant upward deviations. Linear warming trend of 0.7°C per century, combined with natural variability over a 60-year cycle, resulted in rapid warming from 1970 to 2000. Figure 1 shows evidence that climate models have over-tuned this natural variability by means of the greenhouse effect of CO2. The temperature rise stopped after 2000 because natural variability was added with the opposite sign, resulting in a hiatus. Based on this analysis, the author argues that half of the warming is due to natural variability.
According to Akasofu, the linear warming trend of 0.7°C per century is a return from the Little Ice Age that started around 1800, thus the linear trend is also natural variability. Therefore, the theory that half of the recent warming is due to natural variability has been rewritten, and the author has come to understand that most of the warming is due to natural variability. According to Akasofu, CO2 contributes to only 10% of global warming. This is exactly opposite to the IPCC’s explanation that most of the recent warming is caused by anthropogenic CO2.
- The solar constant is not a constant
According to Akasofu, the linear trend of 1°C per 200 years resulting from the return of the Little Ice Age began around 1800, which is before the CO2 concentrations became significant. Therefore, this is a natural variability and not caused by anthropogenic changes in CO2. The Little Ice Age, which lasted from 1400 to 1800, was preceded by the Medieval Warm Period around 1000 AD. This was a time when vegetation flourished in Greenland and the Vikings were active.
The temperature rise from the last glacial period approximately 20,000 years ago to the warm Holocene epoch 12,000 years ago, and the transition from the warm period during the Jomon Transgression to the cooling period 4,000 years ago, are likely due to changes in the terrestrial solar irradiance (TSI) received by the Earth. Changes in TSI are the most likely cause of the temperature changes during the Medieval Warm Period and the subsequent Little Ice Age. The solar constant (a representative value of TSI) during this period cannot be a constant.
While it is impossible to know past TSI with the precision of satellite observations, it may be possible to use long-term temperature changes as input and inversely calculate TSI using a climate model. This is a technique commonly known as an inverse problem. If a climate model were run for 1,000 years using the maximum likelihood estimates of TSI obtained in this way, almost all past climate change could be explained by natural variability. The linear trend of a 1°C rise over the past 200 years would also be considered natural variability, making CO2 radiative forcing unnecessary. Of course, model research involving such obvious causal contradictions is not conducted, but when global warming is explained by CO2, model research involving similar obvious causal contradictions is conducted under the assumption that the solar constant is a constant. This is explained below.
Climate models developed from 1990 to 2000, challenged themselves with reproducing the temperature drop from 1950 to 1970, and the subsequent rapid warming up to 2000. Climate model scientists concluded that the rapid warming from 1970 to 2000 could be explained by an increase in CO2, but it was difficult to reproduce the warm period around 1950. The reason behind the success of the rapid warming at the end of the 20th century was that warming was tuned to the CO2 greenhouse effect under the name of model development using a constant TSI (Figure 1).
Initial climate models in the 1990s included the solar constant as a constant. With the advent of satellite observations of TSI, the first measurement by the Nimbus satellite in 1978 yielded a value of 1372 W/m2. The latest satellite observations in the 2020s subsequently updated the value to 1361 W/m2, which is now incorporated into the model as the solar constant. While there is a 10 W/m2 error across satellites, this is adjusted to the latest accuracy through bias correction. It should be noted that this bias correction assumes no long-term trend. Furthermore, the TSI during solar minimums is adjusted to a constant value.
The solar constant is generally believed to be a constant. The 11-year sunspot cycle is added to the solar constant, but its effect is less than 0.1°C, so it is excluded as a factor in climate change. Prior to satellite observations, direct solar radiation could only be observed from the ground, resulting in an error of 100 W/m2 due to cloud and scattering effects. Even in the satellite era, there was a 10 W/m2 error, and the 2.0 W/m2 radiative forcing due to the CO2 greenhouse effect is considered as the basis for global warming. If the solar constant had fluctuated by as much as 10 W/m2 in the past, the anthropogenic CO2 theory would collapse. While climate models treat the solar constant as a constant, it naturally changes over time scales of 100 or 1000 years. There’s no justification for treating it as a constant.
In the 1990s, the author participated in the MECCA project, funded by the Central Research Institute of the Electric Power Industry, where the author participated in research on 1000-year runs using climate models. Because TSI prior to satellite observations was unknown, a constant value of 1370 W/m2 was used as the solar constant. Consequently, the time series of global mean temperature resulting from the 1000-year run was constant over the 1000-year period, excluding random internal fluctuations. This was a natural consequence of assuming constant TSI.
When the solar constant was assumed to be a constant, climate models are unable to reproduce recent warming after 1970. Therefore, model developers have incorporated radiative forcing from CO2 into their models and tuned the ice-albedo feedback to achieve warming reproduction. All models assumed a constant solar constant, excluded solar changes as a cause of global warming, and then reproduced observed warming through increasing CO2.
After the model successfully reproduced warming, the radiative forcing from CO2 was removed from the model. Then the observed warming trend disappeared, and the model’s temperature change flattened out. From the author’s perspective, this makes sense because the modelers have assumed constant TSI and tuned recent warming through increasing CO2 (Figure 1). Modelers then claim this is proof that global warming is caused by CO2. This is a clear logical contradiction.
The TSI before satellite observations is not precisely known. Some scientists argue that the TSI has changed during the long-term climate changes such as the Jomon Transgression, the Medieval Warm Period, and the Little Ice Age. However, without satellite data, quantitative TSI is unknown. Since specific numerical values are unknown, uncertain values must be fed into the model. Ultimately, as a first approximation the solar constant must be incorporated into the model as a constant when conducting a 1000-year run. However, the assumption of constant TSI leads to the conclusion that global warming is caused by increasing CO2. There is no scientific basis for this. Yet, IPCC insists there is “no doubt” that recent global warming is of anthropogenic origin. Science is not determined by consensus, so at least this part is a fatal flaw. The author believes there is “plenty of doubt,” and agrees with President Trump that “global warming is a hoax.”
- Event attribution is a hoax
In the real atmosphere, changes in TSI are thought to have caused climate changes such as the Medieval Warm Period and the Little Ice Age. While there may be other causes such as albedo changes, CO2 is not the cause. If past long-term climate change could be explained by natural variability, there would be no need to explain recent global warming by increasing CO2.
However, all climate models today assume the solar constant is constant and explain recent warming by an increase in CO2. When the hiatus occurred after 2000, all climate models overestimated warming, predicting continued temperature increases and deviating from atmospheric reality. All climate models have significant model biases. At the origin of this is the logical contradiction of attributing all warming to anthropogenic CO2 radiative forcing.
With this understanding, let’s consider the method of event attribution. For example, when the average August temperature in Tokyo becomes abnormally high, it is assumed that a heatwave that occurs three times every 100 years has now become a once-every-three year due to global warming. Such statistical information is reported as if it is scientific fact.
Once a climate model is successfully constructed, it can be used to perform a 100-year run, for example, 100 times. Because the calculation cost required is enormous, cutting-edge supercomputers are used as part of national science projects. A climate model ensemble with 100 members will have chaotic internal fluctuations, resulting in different prediction data for each model. However, when averaged across all members, the mean internal fluctuations become nearly zero. Therefore, the models share the common property that long-term temperature increases are caused by the greenhouse effect of CO2.
Experiments with and without CO2 increase are compared. The mean value of the model without CO2 increase and its standard deviation, which indicates the variation around it, are calculated. Extreme weather events exceeding twice the standard deviation only occur three times in 100 years. However, models with CO2 increase show higher mean temperatures, making it possible to quantify changes, saying that extreme weather events now occur once every three year due to global warming. The event attribution is a scientific method that asserts that such extreme events would not occur without global warming.
If real-world atmospheric warming is caused by CO2 radiative forcing, and if climate models quantitatively reproduce the temperature change without mean bias, then the frequency of occurrence of random variables around the mean in ensemble experiments makes sense, enabling estimation of the attributes of extreme events. However, as noted above, if half of the real-world atmospheric warming is due to natural variability and only the other half can be explained by CO2 radiative forcing, then estimation of the attributes of extreme events becomes inaccurate. This is especially meaningless if most of the warming is due to natural variability.
While the IPCC’s assertion that there is “no doubt” that global warming is anthropogenic, the estimate by event attribution is useful. However, if this assumption is violated, the frequency of extreme events based on statistical data collected from climate model ensemble experiments become meaningless. The assumption is that all warming observed in climate models is due to increasing CO2. Without showing this assumption is correct by comparing it with the real atmosphere, it is merely delusional, not scientific. Since the author believes that most of the global warming is due to natural variability, the numerical values attributable to extreme events calculated through event attribution all sound false.
In Japan, the former Prime Ministers Suga, Kishida, and Ishiba have continued the net-zero carbon policies by the Biden administration, supporting renewable energy investments, and widespread adoption of electric vehicles. Under the guise of green projects and an energy revolution, the Diet has approved a 150 trillion-yen investment plan over the next 10 years. The source of this funding, in the long run, is tax money. A climate-warming deep state has been established, and a select few are making a big money. Aside from these individuals, most of the people continue to be exhausted by the rising energy prices and resulting inflation caused by net-zero carbon policies.
At the U.N. General Assembly, President Trump stated that “Global warming is a hoax” and that climate change policy is “The greatest con job ever.” The author thinks this is absolutely true. Dr. Akasofu, who has argued in U.S. Congressional hearings that most global warming is due to natural variability, and other researcher’s findings, have been compiled by the U.S. Climate Working Group and are now supported by the President Trump and Republican Party. Japan should also immediately shift course toward decarbonization under the leadership of new (possible) Prime Minister, Sanae Takaichi.
References
Ohashi, M. and H. L. Tanaka, 2010: Data analysis of warming pattern in the Arctic. SOLA, 6A, 1-4.
This piece was first published in Japan by Ieei on September 23, 2025.
Dr. Hiroshi L. Tanaka currently is a Professor Emeritus for the University of Tsukuba, Japan and Visiting Researcher for the Organization of Volcanic Disaster Mitigation: VOLCANO.
Dr. Tanaka received his B.S. in 1980 at the University of Tsukuba, Japan. He earned his Ph.D. in 1988 at the University of Missouri-Columbia, USA.
Download a PDF copy: Climate Change, the Greatest Con Job Ever (U.N. Speech by Trump)