Why Human Contribution to Climate Change is Minimal and Negligible
Why Human Contribution to Climate Change is Minimal and Negligible
by
Rolf D. Reitz
Emeritus Wisconsin Distinguished Professor
University of Wisconsin-Madison
Abstract
More than 80% of mankind’s energy is supplied by fossil fuels. However, several cities are considering banning fossil-fuels and the machines that use them, which are even being blamed for all manner of disasters, including floods, sea level rise, arctic ice melting, droughts, hurricanes, etc. Yet, there has been little-to-no evidence of any out-of-the-ordinary patterns in such disasters over the past century. Of course, it is important to distinguish between the weather (i.e., short term events) and climate change (i.e., long term events[1]), but this distinction is rarely made, and weather-related events are often used opportunistically to induce fear. Careful scientific analysis is needed when considering mankind’s energy use by machines and the environment, and this analysis appears to be lacking. For example, the future of fossil-fuel driven machinery in the automotive sector is being heavily influenced by media claims of climate change. General Motors has announced their intention to go completely electric and has stated “Climate change is real, and we want to be part of the solution by putting everyone in an electric vehicle” [1]. Climate change claims are used to bring about new policies favorable to the green agenda by politicians, funding agents and industry decision makers. However, the extent of global warming and climate change due to humans and their machines is questioned by many reputable scientists [2]. This article discusses the complexity of the question and hopefully will encourage the reader to undertake more exploration and reflection about this important issue.
Introduction
Modern man has become reliant on machines to survive. The energy needed to run machines provides our food, builds our shelters, and provides the wealth that increases our standard of living. As seen in Figure 1 [3], the bulk of our energy is supplied by fossil fuels, and alternatives such as hydro and renewables provide only a small contribution, about 10%. Machines are used in manufacture, agriculture, construction and maintenance, and our planet is also linked by a massive transportation infrastructure that is largely based on Internal Combustion (IC) engines operating on fossil fuel oil. IC engines use about 140 out of the total 580 EJ of energy per year, and provide about 25% of the world’s energy. In doing so, as seen in Figure 2 [4], transportation produces only about 16% of the world’s greenhouse gas (GHG) emissions, including other GHGs such as methane apart from CO2. GHG emissions are thought to influence the earth’s climate and are the subject of much current debate and discussion. In fact, reducing unwanted emissions from our energy use has been the subject of intense research and government regulation for decades. As a result, major advances have been made in vehicle emission control, and vehicle pollutant levels from combustion have been decreased a 1000-fold in the past several decades. Today particulate emissions from tire and brake wear are a larger problem than engine emissions [5].
IC engines power a variety of machines, including utility engines, power generators, construction equipment, as well as road, rail, and marine transport machines. However, recently some automotive vehicle manufacturers intentionally violated emission regulations, causing scandals that have threatened the reputation of all IC engines. This has led to proposals to replace IC engines with electric-drives, or to use IC engines or fuel cells powered with alternative non-fossil-based fuels with the intended goals of further reducing emissions to decrease GHGs. However, replacing the IC engine or replacing its fuel with an alternative fuel does not help avoid cheating and scandals, nor is it an easy proposition. Today’s IC engine is a technological marvel, which has taken decades to develop and will require decades and tremendous expense to replace. In fact, the high maturity of IC engine technology is not shared by many other technologies. Thus, it is necessary to carefully examine the benefits offered by competitor technologies before making hasty and/or inopportune decisions about future directions. The role of fossil-fuel-related emissions on global warming and the resulting potential climate change must be carefully analyzed before making commitments to reject technologies that have served us thus far, prospering for more than a century.
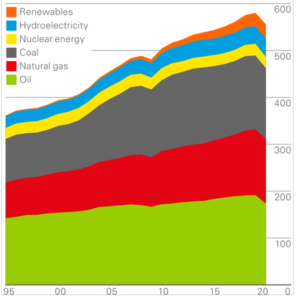
Figure 1. World energy consumption by source (EJ=1018 J) in the last 25 years. About 75% of fossil oil (i.e., about 140 out of 580 EJ) or 25% of total energy is consumed by IC engines and transport [3].
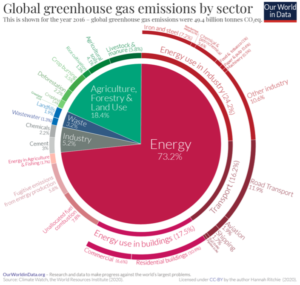
Figure 2. Global Greenhouse Gas Emissions by Sector in CO2 equivalent tons by sector for 2016 [4].
Global Warming and Climate Change
Although there is little-to-no evidence of any significant changes in the earth’s climate since the post-industrial age [2,6,7], man-made global warming proponents are concerned because measured CO2 levels have increased by about 30% over the past 100 years (0.028% to 0.041%), and CO2 has been identified as a greenhouse gas that contributes to global warming. However, skeptics argue that not only are current CO2 levels in the atmosphere negligible compared to levels seen in the history of the planet, but that the infrared radiation wavelengths that are absorbed by CO2 are already saturated, so the maximum CO2 effect on the earth’s temperature has already been reached, as will be discussed further below. Thus, adding more CO2 beyond current levels is not likely to have much effect on global warming. In fact, warming of the earth is related to many other factors, including the natural variability of the climate. In any case, the role of CO2 itself is insignificant compared to that of water vapor, which is present in the atmosphere up to 4%, i.e., 100 times more than CO2. In addition, the H2O molecule has a higher warming potential than the CO2 molecule. Moreover, man’s contribution to global warming gases is tiny compared to that of natural processes, as will also be described below. The earth’s GHG concentration involves the planet’s biological system, which plays a major role and is very complex, making accurate predictions of future trends extremely difficult.
The United Nations International Panel of Climate Change (IPCC) relies on computerized models built on data and formulas to represent atmospheric conditions that reflect the hypothesis that CO2 is the principal factor driving planetary warming and climate change. In fact, climate models are not accurate enough for their predictions to be used to justify politically motivated decisions [2,8]. These uncertainties make it essential that we address the question of whether climate change is really an urgent concern worthy of disrupting the use of available energy sources for our machines.
Figure 3 shows how the global temperature on the planet has changed over the last 170 years [9,10]. It is seen that the earth’s average temperature has hovered very close to 57o F. Parenthetically, note that it is difficult to express the entire world’s annual temperature with one number, considering also that the temperature over more than 85% of the earth’s surface is not monitored. In fact, there are fewer weather stations in operation now than there were in 1960 [11]. As we know, the temperature varies from place-to-place and during the day and night, as well as throughout the seasons. Nevertheless, climate scientists agree that there has been a modest increase in global temperatures (increasing between 0.13 and 0.25°F per decade since 1975). The planet’s main source of heat is the energy from the sun. The sun’s flux at the upper atmosphere is 1.36 kW/m2 while the average flux reaching the earth’s surface is only 240 W/m2 [12], so only 17.6% of the sun’s energy radiating towards the earth reaches the earth’s surface on average. The remaining 82.4% is scattered by the atmosphere and clouds, and accounts for nighttime, surface curvature, and so on. Knowing the earth’s surface area, we can calculate the total solar power that would be available if captured. Comparing it with man’s total energy consumption, we find that we get more energy from the sun in 1.5 hours than the entire world’s energy consumption in one year. In other words, it will take us more than 6,000 years at current consumption rates to use the amount of energy we get from the sun in one year. Based on this fact it is reasonable to ask if our miniscule energy use can really be causing an urgent climate crisis.
Carbon Balance on the Planet
It is instructive to analyze the planet’s carbon balance when discussing the production of CO2. Most of earth’s carbon, 65.5 trillion tons, has been stored in rocks for millions of years (‘slow’ carbon) [13]. The rest, the ‘fast’ carbon, is in the ocean, atmosphere, plants, soil, and fossil fuels, as shown in Figure 4. As can be seen, 68% of this carbon resides in the deep oceans. 18% is in the fossil pool, which includes the stored oil and coal from ancient plant life that we extract for much of our energy. 4% of the carbon is in the soil and 1.5% is in the atmosphere. 1% resides in the plant mass and 1.8% in the surface ocean.
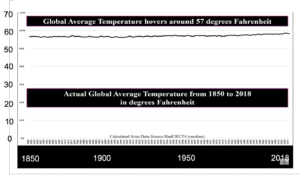
Figure 3. Global average temperature from 1850 to 2018 in degrees Fahrenheit from HadCRUT4 [10].
The large white arrows indicate the direction of balance between the atmosphere and the earth’s surface. For example, it shows that photosynthesis consumes CO2 from the air, whereas plant respiration and decomposition exude CO2 back into the atmosphere. Similarly, a very important contributor is the air-sea interchange since CO2 is soluble in water, and there are significant phytoplankton populations that participate by consuming and exuding CO2 like the plants do on dry land.
210 GtC (giga (=109) tons of carbon) are produced by the plants each year via plant respiration, decaying vegetable matter and by marine life in the oceans. This 210 GtC is added to the 800 GtC in the atmosphere showing that the atmosphere turns over every four years. Human energy use accounts for 9 GtC per year. This comes from the burning of fossil fuels and from other activities, such as the manufacture of cement, plus land use. Thus, humans rearrange 9 out of the ‘fast’ 57,650 GtC on earth, sending 4 GtC into the air and returning 5 GtC to the plants and the oceans. This results in the estimate that 55% of man’s emissions go back into the plant life and the oceans each year, while 45% remains in the atmosphere. Note that 20 to 30% of the net 4 GtC we emit comes from cement production (e.g., 82% of the weight of a wind turbine is concrete [14]) and from land use [15]. The land use includes GHG emissions from energy used in pumping water, making fertilizers, applying pesticides, processing, and packaging food stuffs, etc., which are all energy intensive processes.
CO2 from Transport
As discussed in Fig. 1, transport uses about 25% of our energy and thus contributes about 1 GtC out of the 4 GtC added to the natural 210 GtC exchanged with the air each year. That is 1/800 = 0.1% is added from vehicles to the 800 GtC in the atmosphere each year. It is instructive to check just how much CO2 comes from IC engines and transportation because we know how much fuel we use.
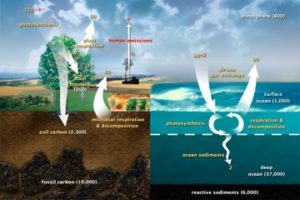
Figure 4. Fast carbon cycle on the planet. Of the 57,650 GtC that is exchanged between the shown reservoirs, 800 GtC is in the atmosphere, to which man contributes a net 4 GtC per year [13].
The world’s vehicles use 2.9 billion gallons per day and given the population of 7.6 billion humans (2020), this is 0.38 gal/person/day or 1.08 kg-fuel/person/day. Using the representative chemical balance equation describing fuel consumption
C8H18 + 12.5(O2+3.76N2) = 8CO2 + 9H2O+47N2 (+ 48 MJ/kg-fuel). …………….. (1)
one molecule of hydrocarbon fuel (taken as iso-octane for simplicity) produces 8 molecules of CO2 and 9 molecules of water, plus releases a lot of energy. So, vehicles must emit 2.9 x10⁹ (gal/day)*2.84 (kg-fuel/gal)*3.1(kg-CO2/kg-C8H18)*365(day/yr) = 9.32 GtCO2/year (giga-tons of CO2). The total air mass in the atmosphere is 5×10¹⁸ kg, so the mass of CO2 added to earth’s atmosphere from vehicles is 9.32×10¹² / 5×1018 = 1.86×10-6 = 1.86 ppm/year. However, transport’s consumption of fuel energy is only 25% of our energy used, so man’s total energy use must emit 7.44 ppm/yr CO2 (=1.86/0.25). The actual measured CO2 increase in the atmosphere was only 2.87 ppm in 2019 not 7.44 ppm, so we conclude that 61% of human-energy-derived CO2 returns to the earth (for example, for fixation by photosynthesizing plants), and 39% (= 2.87/7.44) stays in the air, a bit less than the 45% estimate of Figure 4.
CO2 from the Earth’s biomass
The above analysis assumes that all of the CO2 excess in the atmosphere comes only from humans and our fossil fuel use, which is clearly untrue since there are many other sources of CO2 on the planet, as discussed next. Also, it is important to note that the effect of a CO2 molecule in the atmosphere on the climate is independent of its source of origin. Thus, it is not reasonable to single out man’s contribution only while ignoring all other sources of CO2.
The total carbon in the planet’s biomass is shown in Figure 5 [16]. Plants are the dominant kingdom (≈450 GtC). The 550 GtC plant biomass shown in Fig. 4 presumably includes the bacteria (≈70 GtC) and archaea (≈7 GtC), yielding a similar estimate to the total 545.2 GtC of carbon in the earth’s biomass shown in Fig. 5. In Fig. 5A it is seen that the animals represent 2 GtC (tiny grey triangle at bottom
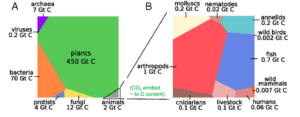
Figure 5. As shown in B, animals are only 2 out of the 545.2 GtC biomass on earth [15].
right). Moving to Fig. 5B, which further subdivides the animals, it is seen that humans and our livestock represent about 0.16 GtC out of the 2 GtC, or 8% of the total carbon in the animals. But, relative to the total biomass, humans and our livestock represent only 0.029% of the mass of carbon on the planet.
As discussed above, vehicles emit about 3.34 kilograms of CO2 per person per day (=1.08*3.1). 7.6 billion humans each exhale about one kilogram of CO2 every day [17], which is thus equivalent to 30% of the CO2 emitted by our transportation sources. Making the reasonable assumption that all animal life on earth emits CO2 in proportion to the amount of carbon it contains (i.e., no life form is vastly more or less efficient than others in converting its fuel/food to CO2), and adding our livestock, gives the combined breath of humans and our livestock to be equivalent to 80% of the CO2 emitted by transportation vehicles (=30%*0.16/0.06). However, if we include all the animals in Fig. 5B, it is seen that the animals breathe out 33.3 (=2/0.06) times more CO2 than humans do, or 26.7 times more CO2 than that emitted by our transportation vehicles (0.8*33.3). Since transport is only 25% of our energy use, this means that the animal kingdom’s breath alone contributes 6.67 times as much CO2 as all human-derived CO2 emissions.
The fish and the marine life in the world’s waterways and oceans produce much more CO2 (possibly 10 times more) than do humans (0.7 vs. 0.06). Despite this fact, the fish are not blamed by climate activists for contributing to ocean acidification as humans are blamed. There are other potential CO2 sources, such as from aerobic bacteria that are part of the 70 GtC seen in Fig. 5A, and which contain 100 times more carbon than the fish, and a 1,000 times more carbon than humans. Of course, other sources of CO2 include the major source, the plants and their respiration and natural decay, as shown in Fig. 4. In addition, forest wildfires in 2021 emitted 6.45 GtCO2 compared to the 9.32 GtCO2 from transportation [18]. This amount is similar to the CO2 breathed out by humans and their livestock (7.5 GtCO2) and is also not specifically accounted for in Fig. 2. Thus, we can conclude that our planet has major sources of CO2 that are totally unrelated to our energy use. Absorption and buffering of CO2 by the oceans and plants takes this up. It is hard to justify how man’s small contribution to the carbon cycle is justified as a reason for urgent action regarding climate change.
How much CO2 can humans tolerate?
The 2019 the atmospheric CO2 level was 415 ppm, and it is reported to be increasing by about 2.87 ppm each year. It is worth noting that exhaled human breath is contains 38,000 ppm of CO2, and CO2 is considered to be minimally toxic by inhalation. Indoor CO2 levels are typically around 1,000 ppm, and in crowded venues such as classrooms and concerts, levels can reach 3,000 ppm [19]. The IPCC states that doubling of CO2 levels (i.e., reaching 830 ppm, which will occur at present rates in 143 years in the middle of the 22nd century) will increase atmospheric temperatures by 3o C [2], and that this temperature rise will have major impacts on climate, causing sea level rise, hurricanes, and flooding. However, CO2 levels in the 800-ppm range will have only minor effects, if any, on human health[2]. In any case, man has almost a century and a half to address this issue at current rates (if indeed man was solely responsible for the increase in CO2 levels in the atmosphere). Again, this begs the question whether it makes sense to disrupt major industries and the machinery that elevates much of the developing world out of poverty based on clearly miniscule effects?
Green House Gases (GHGs) and the Atmosphere
The red region in Figure 6 [20] depicts the spectral intensity of the insolation or solar radiation flux as a function of wavelength coming from the sun and landing on the earth. Due to the high temperature of the sun, solar radiation is in the short wavelength Ultraviolet (UV) and visible ranges of the spectrum. Figure 6 shows that only 70 to 75% of the sun’s energy actually penetrates the atmosphere and lands on the earth. The balance is reflected back into space from the cloud cover, from the atmosphere and from the earth’s surface. The earth, heated by the incoming radiation flux, is relatively cool and radiates energy back into space in the long wavelength dipole Infrared (IR) range (shown in blue). Satellite measurements, indicated by the arrow pointing to the blue region, show these long wavelengths. The black curve corresponds to the Planck radiation curve that corresponds to average surface temperature on the planet (57o F). Figure 6 shows that there are whole regions of the blue plot where no energy leaves the earth (shown as white), giving rise to the greenhouse effect, which accounts for absorption and scattering phenomena in the atmosphere. Energy absorption by greenhouse gases keeps the earth habitable, since without this effect the average surface temperature would be only 1o F instead of 57oF.
The panel directly below the spectral intensity plot shows the total absorption and scattering as a function of wavelength. Below that (3rd panel) it can be seen that absorption is primarily due to water vapor, which contributes 70 to 90% of the greenhouse effect. The effect of CO2 is shown in the 4th panel. CO2’s 15-micron wavelength band center (indicated by the vertical red line) can be seen to have been almost totally absorbed, indicating that CO2 is already virtually saturated and opaque, and that no radiation leaves in that wavelength range. This shows that adding more CO2 to the atmosphere will produce negligible further greenhouse gas effect. This can be explained as being analogous to painting part of a transparent window black – no more light will pass through that portion of the window, no matter how much additional black paint is added. There are of course other greenhouse gases in the atmosphere that are of interest, as indicated in the remaining panels shown in Fig. 6. These include ozone and nitrous oxide, powerful greenhouse gases, but they are present in much lower concentrations than the other gases. It is interesting to observe that some of these gases are not due to human activities, but rather are due to the thousands of lightning strikes that occur on the planet each day.
CO2 and the Climate
CO2 is a trace gas in the atmosphere. Its concentration is .042% of the atmosphere while water vapor’s concentration ranges from 1.3% to as high as 3% and can be almost two orders of magnitude greater than CO2, depending on the local temperature, as shown in Fig. 7 [21]. Note that 71% of the earth’s surface is covered by water, which is the source of the humidity on the planet and is essential for life. Indeed, global precipitation or rain is 5×10¹⁷ kg-H2O per year, which is 4 orders of magnitude more than the total amount of CO2 emitted by humans (3.7×10¹³ kg-CO2), and thus would be expected to have a much larger influence on the climate than CO2.
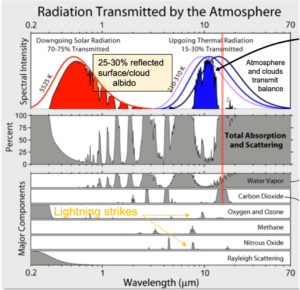
Figure 6. Radiation transmitted and total absorption and scattering by the atmosphere as a function of wavelength [20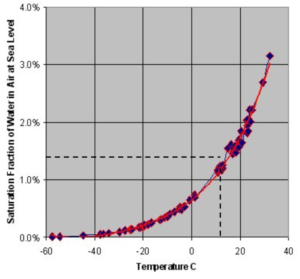
Figure 7. Saturation fraction of water in air at sea level as a function of temperature [21].
In fact, global warming’s sensitivity to the clouds and the sun’s radiation is rarely discussed or included in models of the climate despite its major role due to the many uncertainties in estimating this important effect. The Stefan-Boltzman Law [22] provides a simplified energy balance between the energy arriving at the earth’s surface from the sun (Sunflux *(1-a)) and that radiated back into space (in the absence of convective or other effects), viz.,

a is the albedo due to clouds and scattering, and ranges between 30 and 25%, as shown in Fig. 6. If we assume that a=30% and then reduce it to 27%, the earth’s surface temperature, Tsurf, is predicted to increase from the reduction in cloud cover by 3oC degrees. And, as shown in Fig. 7, increasing the temperature increases the amount of water vapor in the atmosphere, leading to more clouds. The result is that cloud cover provides a self-correcting system. This example shows that a small change in cloud cover gives a similar temperature change to the IPCC’s 3oC metric obtained from doubling the atmospheric CO2 concentration.
This bears repeating – a small change in cloud cover, induced by daily temperature changes at the earth’s surface, can compensate for a doubling of atmospheric CO2 concentrations, which would take about 150 years to accomplish at the present rate of about 2.87 ppm increase per year.
Regarding the effect of higher concentrations of CO2 gas on the atmosphere’s temperature, a 1st Law energy balance relates the temperature increase to the energy stored in the molecules in the air. Not only is CO2 much less present (i.e., CO2’s contribution to the mass of the atmosphere is relatively small), but it’s specific heat (cp=0.84 J/g.K) is only half that of water (1.85 J/g.K) and less than that of the air (1.0 J/g.K). This indicates much more thermal energy is stored in the air and in water vapor than in CO2 in any case.
There are other factors to consider when assessing the role of CO2 on the climate. CO2 is used by plants to grow. NASA data has shown that there has been more greening on the planet coincident with the increasing levels of CO2 in the atmosphere, and the world-wide leaf area is increasing at ~2.3% per decade [23]. Accounting for this, in 2100 (i.e., 80 years from now) land uptake will have increased by at least ~5%, and the ocean uptake will increase by ~10%, giving a total of 15% less airborne CO2 than in the 45% estimate of Fig. 4. This reduction to 30% lessens the argument that CO2 stays in the atmosphere ‘forever,’ which is often used to bolster arguments that CO2 emissions must no longer be tolerated (i.e., net-zero) by alarmists. It is also important to note that photosynthesis or greening causes cooling since the CO2 absorbed by plant material produces sugars via pathways that are effectively the reverse of Eq. (1) that describes heat release by combustion. Thus, leaf area increase reduces the effect of global warming correspondingly in another self-regulating effect.
Finally, some scientists believe that the global CO2 levels in the atmosphere also correlate with changes in the ocean surface temperature. Figure 8 [24] shows that with increasing temperature, CO2 becomes less soluble in water and thus would enter the atmosphere, which could explain the current observed increase in CO2 levels since global temperatures are increasing slightly. Alternatively, the observed CO2 increases have been attributed to the Pacific Decadal Oscillation, which is a long-lived El Niño-like pattern of climate variability due to currents, which take hot or warm water from the equator to the northern parts of the world and then change phase every 60 years or so. Similar oscillating flow patterns exist in the Atlantic Ocean.
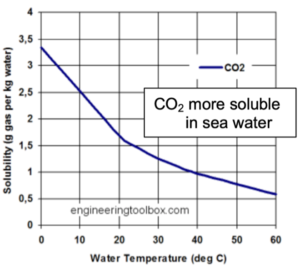
Figure 8. Solubility of CO2 in water as a function of temperature [24].
Conclusions – Prospects for the Future
It is essential to make a careful and accurate assessment of the effects of society’s carbon footprint on global warming, on human health, as well as on the energy needs of humanity, including those of less advanced nations. This article questions whether CO2 is really a concern worthy of totally disrupting the world’s energy use. It is shown that man’s contribution to atmospheric CO2 levels is miniscule compared to other sources of CO2 on the planet, which are not under human control, and which are totally unrelated to our energy use. For example, we conclude that the animal kingdom alone breathes out almost an order of magnitude more CO2 than that from all of man’s energy consumption. Absorption and buffering of CO2 by the oceans and plants takes CO2 up. Moreover, as discussed above, the earth itself has self-regulating mechanisms, including via cloud cover and the water cycle, which controls the planet’s temperature, and via leaf area increase (greening), which controls CO2 levels and provides the corresponding cooling by creating sugars.
The use of Battery-Electric Vehicles (BEV) instead of using IC engine powered vehicles brings about new sustainability questions for technologies that rely on limited rare-earth metals that the IC engine does not require. BEVs are powered by the electricity grid that is connected to power generation stations. Power stations located outside of cities that still rely on fossil fuels to generate the electricity will not reduce global CO2 emissions. Indeed, the efficiency of fossil fuel power plants, together with electricity transfer and storage, is no better than that of the fossil-fuel-powered IC engine-powered vehicle that can operate reliably under all temperature extremes, which the BEV cannot [5]. It is often claimed by proponents that fossil fuel will be displaced by renewable energy (i.e., wind and solar). As seen in Fig. 1, global levels of renewable energy are still only below a few percent, and would take decades to reach impactful levels, even if mankind was prepared to devote the required huge tracts of land to power generation, and only if we discover means of storing the generated power for use in the absence of wind and sunshine.
In fact, for transportation there is still much scope for improving the efficiency and environmental impact of internal combustion engines, which represent over 100 years of research optimizing safety, reliability, and the efficiency of human energy use. Research directions that further improve the diesel engine, which is the most efficient engine known to man, are encouraged [5]. Many of the developments such as fuel injection and turbocharging that have improved the efficiency of the diesel are now also being used in gasoline, spark-ignition engines. Important research areas include further development of after-treatment technologies to further reduce emissions and to advance new combustion strategies for energy efficiency improvements. The expanded use of renewable fuels and the introduction of hybridization are other research areas of interest. Heavy duty transport in over-the-road-trucks consumes 25% of the fuel used in the United States. These trucks and construction equipment (earth movers, tractors, and graders, etc.) worldwide are not likely to be replaced by battery operated machines due to the unacceptable weight and recharge times of batteries. Thus, those cities that plan to ban the use of fossil fuels and internal combustion engines will face the prospect of having no new construction or repair if they hold to their goal.
Finally, it is disproportionate to quote man’s small CO2 contribution to justify urgent action regarding climate change. Whether CO2 turns out to have important effects on man’s future on earth or not, cannot be calculated or controlled. There is currently little-to-no evidence of any changes to the earth’s climate [2], and as discussed above, at present rates the timescale of GHG and CO2 build-up to levels that are of concern to the IPCC is around a hundred and fifty years. Of course, it is prudent and important that we continue to perform research to improve our energy use, as well as the efficiency of our machines, including internal combustion engines. But, to provide perspective on the IPCC’s 150-year timescale it is worth noting that America’s oil (“black gold”) industry officially only began about 160 years ago with a commercial well in Pennsylvania, and the first U.S. automobile show took place in New York in 1900 [25]. Human history, and the forces that drive human progress, change rapidly. For example, fossil energy resources on earth are limited, and the fossil age will likely wane in the next century, relegating the CO2 issue to history. Clearly, the details of human energy supply and use in the next century cannot be known and will continue to be a subject of speculation [26]. Our situation 150 years from now will differ from today’s as much as our present situation differs from that in 1870, and human ingenuity (science) will continue to provide for society’s needs as history evolves. It is foolhardy to deny energy realities based on specious short-term global warming and climate change arguments. Constituencies in those cities that ban the use of IC engines will need to make their politicians realize that a crumbling civilization is not an acceptable exchange for quelling scientifically unfounded fears.
References
- https://www.gm.com/electric-vehicles (accessed 3/2022).
- Koonin, S.E., “Unsettled: What Climate Science Tells Us, What it Does’nt, and Why it Matters,” BenBella Books, Inc., Dallas, TX, 2021, p.54.
- BP. Statistical review of world energy. BP Magazine, July 2021, (accessed 3/2022). https://www.bp.com/en/global/corporate/energy-economics/statistical-review-of-world-energy/primary-energy.html
- Ritchie H., and Roser M. Greenhouse Gas Emissions. Our World in Data, 2020, https://ourworldindata.org/greenhouse-gas-emissions (accessed 3/2022).
- Reitz, R.D., Ogawa, H., Payri, R., et al. “The future of the internal combustion engine, International Journal of Engine Research Editorial, September 24, 2019. https://doi.org/10.1177/1468087419877990
- Department of Atmospheric Science, Tropical Meteorology Project, Colorado State University.” North Atlantic Ocean Historical Tropical Cyclone Statistics.” 2020. http://tropical.atmos.colostate.edu/Realtime/index.php?arch&loc=northatlantic
- EPA.”Climate Change Indicators in the United States.” https://www.epa.gov/climate-indicators (accessed 3/2022)
- Femke J.M., Nijsse, M., Cox, P.M., and Williamson, M.S., “Emergent constraints on transient climate response (TCR) and equilibrium climate sensitivity (ECS) from historical warming in CMIP5 and CMIP6 models,” Earth Syst. Dynam., 11, 737–750, 2020.
- Humlum, O., The State of the Climate 2020, Report 50, 2021, The Global Warming Policy Foundation, https://www.thegwpf.org/content/uploads/2021/05/State-of-the-Climate-2020.pdf
- Met Office Hadley Centre HadCRUT temperature data: http://hadobs.metoffice.com/.
- https://www.heartland.org/news-opinion/news/avalanches-of-global-warming-alarmism (accessed 3/2022).
- Lindsey, R. “Climate and Earth’s Energy Budget,” NASA, 14 January, 2009. https://earthobservatory.nasa.gov/features/EnergyBalance (accessed 3/2022)
- Riebeek, Holli “The Carbon Cycle,” Earth Observatory, NASA,16 June 2011. https://www.earthobservatory.nasa.gov/features/CarbonCycle
- https://www.freeingenergy.com/math/wind-turbine-weight-pound-mwh-gwh-m148/ (accessed 3/2022).
- World Resources Institute: https://www.wri.org/blog/2020/02/greenhouse-gas-emissions-by-country-sector (accessed 3/2022).
- Yinon M. Bar-On, Phillips, R., and Milo, R. “The biomass distribution on Earth,” Proceedings of the National Academy of Sciences, Vol. 115, No. 25, pp. 6506-6511, 2018. https://www.pnas.org/doi/10.1073/pnas.1711842115
- https://www.globe.gov/explore-science/scientists-blog/archived-posts/sciblog/2008/08/11/release-of-carbon-dioxide-by-individual-humans/comment-page-1/index.html (accessed 3/2022).
- https://www.weforum.org/agenda/2021/12/siberia-america-wildfires-emissions-records-2021/ (accessed 3/2022).
- FSIS Environmental, Safety and Health Group, 2020, https://www.fsis.usda.gov/sites/default/files/media_file/2020-08/Carbon-Dioxide.pdf (accessed 3/2022).
- https://commons.wikimedia.org/wiki/File:Atmospheric_Transmission.png (accessed 3/2022).
- https://www.chegg.com/homework-help/questions-and-answers/question-17-1-point-using-figure-8-match-following-air-temperatures-approximate-maximum-ab-q37126551 (accessed 3/2022).
- https://en.wikipedia.org/wiki/Stefan%E2%80%93Boltzmann_law (accessed 3/2022).
- https://www.warpnews.org/human-progress/nasa-the-earth-is-greener-now-than-it-was-20-years-ago/ (accessed 3/2022).
- https://www.engineeringtoolbox.com/gases-solubility-water-d_1148.html (accessed 3/2022).
- https://aoghs.org/petroleum-discoveries/ (accessed 4/2022).
- Abbott, D., Keeping the energy debate clean: How do we supply the world’s energy needs?, Proc. IEEE, vol. 98, no. 1, pp. 42–66, 2010.
[1] The UN’s world Meteorological Organization defines climate as the average weather over thirty-years.
[2] 5,000 ppm (0.5%) is the OSHA Permissible Exposure Limit and Threshold Limit Value for 8-hour exposure [19].