Livestock, Methane and Climate
D. Alexander
Methane Science Accord, Clevedon, New Zealand
J. D. Ferguson
University of Pennsylvania School of Veterinary Medicine, USA
A. Glatzle
Asociaci´on Rural del Paraguay, Asunci´on
W. Happer
Department of Physics, Princeton University, USA
W. A. van Wijngaarden
Department of Physics and Astronomy, York University, Canada
January 27, 2026
Abstract
Methane emissions by livestock have a negligible effect on Earth’s temperature. For example, killing all of the approximately 1.6 billion cattle on Earth in the year 2025, when this paper was written, would only reduce atmospheric methane concentrations enough to change the temperature by ΔT = −0.04 C. Killing all 1.3 billion sheep would lead to a temperature change of ΔT = −0.004 C. New Zealand’s pledge to reduce methane emissions of their livestock by 14% to 24% from those in the year 2017 would change the temperature by ΔT = −0.000005 to − 0.000008 C, far too small to measure. These are maximum temperature savings where methane emissions from domestic livestock are not replaced by other sources (such as wild ruminants and termites) during the inevitable rewilding of managed grasslands and rangelands.
Introduction
Ruminant livestock like cattle, sheep, and goats, emit methane to obtain maximum nutritional energy from their forage. Anaerobic fermentation by rumen microorganisms converts structural carbohydrates, like cellulose and hemicellulose, into nutritional organic molecules, most notably acetic, propionic and butyric acids or volatile fatty acids (VFA). The microorganisms themselves provide proteins and other nutrients when they are digested in subsequent parts of the alimentary tract.
An unavoidable byproduct of rumen fermentation is methane gas, CH4 [1]. The growth of methanogenic archaea is powered by Gibbs free energy increments released when methane molecules are formed. One of several important methanogenic reactions [1] is

Under typical physiological conditions of the rumen, each CH4 molecule released in reactions like (1) can generate one or two energy-carrier molecules, adenosine triphosphate (ATP).
On a per molecule basis, methane causes about 30 times more radiative forcing than carbon dioxide [2]. Nevertheless, ruminant methane emissions cause global temperature changes that are too small to measure. In this brief note we review the quantitative bases for these statements. We will pay special attention to methane emissions by New Zealand cattle and sheep.
Atmospheric Properties
The mean surface pressure of Earth’s atmosphere, which is slightly smaller than mean sealevel pressure because of higher-altitude land surfaces, is [3]
We assume an altitude-independent acceleration of gravity
Substituting (3) into (2) we find that the atmospheric mass per unit area is
Most of the surface mass density (4) is due to nitrogen, oxygen and argon, but it includes a small and variable contribution from water vapor, carbon dioxide, methane and other trace gases. We can approximate the average mass of an atmospheric molecule as [4]

Here one mole (mol) is Avogadro’s number NA of molecules,
The average number density of air molecules above Earth’s surface is therefore
The mean radius of the Earth is [5]
The total number of molecules in Earth’s atmosphere is therefore
Methane Emissions by Cattle
We will use the symbol B, from the scientific name Bos taurus or Bos indicus of the most abundant domesticated species of cattle, to denote the number of cattle on Earth. According to reference [6], the total number in the year 2023 was
an increase from
in the year 1961. The increase has been nearly linear with time, so we will approximate the total number of cattle with the function of the calendar year t,

Eqs. (10) and (11) imply that the coefficients aB and bB of (12) are

Using the values of aB and bB of (13) in (12) we estimate the number of cattle in the year 2025 to be

about 1 cow for every 5 of the 8.2 billion people on Earth [7].
Methane emissions per cow depend on many factors: the feed intake, the feed composition, the weight and age of the cow, whether the cow is raised for meat or milk, etc. We will take a representative emission rate per cow to be [8]

In units of molecules per unit time, (15) becomes
The numerical value on the second line of (16) comes from the average mass of a methane molecule, CH4

According to reference [9]:
The average time that a physical methane molecule is in the atmosphere is estimated to be around 9.6 years. However, the average time that the atmosphere will be affected by the emission of that molecule before reaching equilibrium – known as its ‘perturbation lifetime’ – is approximately twelve years.
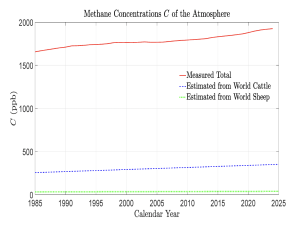
Figure 1: Comparison of measured methane concentrations C of the atmosphere [9] to the calculated fraction (21) from cattle and (31) from sheep for the years 1985 to 2025.
We will therefore take the mean lifetime of a methane molecule in Earth’s atmosphere to be
Oxidation by hydroxyl radicals, OH, to carbon dioxide, CO2, and water vapor, H2O, is the main destruction mechanism of methane molecules CH4 [9].
The number of methane molecules NB in Earth’s atmosphere due to emissions from cattle will change at the rate
The solution to the simple differential equation (19) is,
The first line of (20) gives the number of methane molecules in the atmosphere at time t due to the cattle numbers B(t′) at all past times t′. In the subsequent lines of (20) we have assumed the linear dependence (12) of B(t′) on emission time t′. The dashed blue line of Fig. 1 shows the estimated time dependence of the atmospheric methane concentration due to cattle,
To evaluate (21) for plotting Fig. 1, we used the value of sB from (16), the value of τ from (18), the value of N from (9), and the function B = B(t) from (12). Also shown in Fig. 1 is the measured time dependence of the total methane concentration [9]. For the estimated cattle numbers B of (12) and the annual methane emission per animal (15), the atmospheric concentration of methane due to cattle in the year t = 2025 is

about 17% of the atmospheric inventory.
Differentiating (21) and using (12), we find that the rate of change of the methane concentration (21) due to cattle is
The number of the last line of (23) came from evaluating the previous line with (9), (13), (16) and (18). The relative rate of increase, from (22) and (23), is less than 1 % per year
Methane Emissions by Sheep
After cattle, sheep are the next most important ruminant animal. We will use the symbol O, from the scientific name of sheep, Ovis aries, to denote the number of sheep on Earth. According to reference [10], the total number of sheep in the year 2025 was about 1.3 billion,

an increase from about

in the year 1961. The year-by-year fluctuations of the world sheep population, O(t), have been larger than those for cattle [6]. But a linear approximation that gives the sheep populations (25) and (26), and which is good enough for our purposes, is
where

We will take a representative emission rate per sheep to be 22.2 g day−1 [11] or approximately
In units of molecules per unit time, (29) becomes
where the mass mCH4 of a methane molecule was given by (17). The dotted green line of Fig. 1 shows the estimated atmospheric methane concentration due to sheep,
To evaluate (31) for plotting Fig. 1, we used the value of sO from (30), the value of τ from (18), the value of N from (9), and the function O = O(t) from (27). For the estimated sheep numbers O of (27) and the annual methane emission per animal (29), the atmospheric concentration of methane due to sheep in the year t = 2025 is
about 2% of the atmospheric inventory
Differentiating (31) and using (12), we find that the rate of change of the methane concentration (21) due to sheep is
The number of the last line of (33) came from evaluating the previous line with (9), (18), (28) and (30). The relative rate of increase, from (32) and (33), is even smaller than the rate (24) for cattle,
Radiative Forcing and Warming
According to Eq. (36) of reference [12] a small change ΔC of the atmospheric concentration of methane will cause a corresponding change ΔF of radiative forcing at the top of the atmosphere,

In (35) the column density ˆN of atmospheric molecules was given by (7). According to Table 3 of reference [12] the forcing power P per added CH4 molecule for the current atmosphere is

According to Eq. (42) of reference [12], the forcing change, ΔF, of (35) would lead to a temperature change, ΔT, given by
We will call the factor ∂Z/∂T of (37) the cooling capacity of the Earth. It is the small increase, ∂Z, of flux to space produced by a small increase, ∂T, of the average surface temperature. As one can see from (37), for a given forcing, ΔF, the temperature increase ΔT needed to maintain the cooling flux of thermal infrared radiation to space equal to the solar heating flux is inversely proportional to the cooling capacity. We will use the numerical value of the cooling capacity given by Eq. (43) of reference [12].
Since cattle make a measurable contribution to the atmospheric methane inventory, as shown in Fig. 1, one might ask how much cooling would result if all cattle were destroyed, and their contribution to the atmospheric methane inventory dropped to zero. According to (35), removing all of this methane would give a radiative forcing of
To get the number on the second line from the first, we used the value of P from (36), the value of ˆN from (7) and the value of CB(2025) from (22). According to (37) the forcing (39), due to eliminating all cattle on Earth, would cause a temperature drop of
To complete the temperature drop (40) would require several multiples of the atmospheric residence time, τ = 9.6 y, from (18).
In the year 2025, the atmospheric concentration of methane due to sheep was given by (32). According to (35), removing all of this methane would give a radiative forcing of
According to (37) the forcing (41), due to eliminating all sheep on Earth, would cause a temperature drop of
New Zealand’s Pledge
New Zealand has pledged [13] that by the year 2050 it will reduce methane emissions of their livestock by 14% to 24% below those of the year 2017. From reference [14] we estimate the number of New Zealand cattle for the year 2017 as

The number of New Zealand sheep in the year 2017 was [14]

Therefore the total New Zealand emissions of methane in the year 2017 were very nearly
To get the numerical value of the second line, we used (43) and (44) with the numerical values of annual emissions per cow and sheep, SB and SO, from (15) and (29). Reducing these emissions by 14 – 24% would give a concentration reduction of
Here the mass per methane molecule mCH4 was given by (17) and the total number of atmospheric molecules N was given by (9). The corresponding radiative forcing (35) is
where we used (7) and (36) to get the numbers of the second line. The averted temperature rise follows from (37) and is
less than one hundred thousandth of a degree C and much too small to measure.
Summary
Absurdly small contributions to Earth’s temperature are caused by the methane emissions of ruminant livestock. According to (40), killing all the 1.6 billion cattle on Earth would cause a temperature change of about ΔTB = −0.04 C, provided that rewilding of managed grasslands and rangelands, covering around a quarter of the Earth’s land surface, does not replace this source of methane emissions with other sources (such as wild ruminants and termites). Then there would be practically no reduction of temperature. According to (42) killing all the 1.3 billion sheep on Earth would cause a temperature change of about ΔTO = −0.004 C. According to (44), achieving New Zealand’s goal of reducing emissions by cattle and sheep by 14% to 24% from those of the year 2017 would change the world temperature by about ΔTnz = −0.000005 to − 0.000008 C, much too small to measure. Policies to reduce ruminant methane emissions are “all pain, no gain.” No rational person would invest a single dollar to achieve such insignificant temperature reductions. But some climate policies demand this.
The radiative forcing (36) for methane that we use to make these estimates is slightly larger than the best IPCC values, as one can see from Table 3 of reference [2]. As discussed in reference [12], our best estimate of the cooling capacity, ∂Z/∂T = 5.6 W m−2 K−1 of (38), is about three times larger than those typically used by the IPCC, ∂Z/∂T = 1.8 W m−2 K−1, given by Eq. (48) reference [12] and corresponding to strong positive feedback. But even if we use the smaller cooling capacity of the IPCC in (38), the warming averted by a 14% to 24% reduction of methane emissions by New Zealand livestock would only be ΔT = −0.000015 to − 0.000025 C, still much too small to matter or even measure. It is doubtful that strong positive feedbacks exist, since this would violate Le Chatelier’s Principle [15], that most feedbacks in natural systems are negative.
References
[1] G. Gottschalk and R. K. Thauer, The Na+-translocating methyltransferase complex from methanogenic archaea, Biochemica et Biophysica Acta, 1505, 28-36 (2001). https://www.sciencedirect.com/science/article/pii/S0005272800002747?ref= pdf_download&fr=RR-9&rr=9af854069a58ea22
[2] W. A. van Wijngaarden and W. Happer, Dependence of Earth’s Thermal Radiation on Five Most Abundant Greenhouse Gases, Atmos. & Oceanic Phys. arXiv: 2006.03098 (2020).
[3] Mean atmospheric surface pressure, https://en.wikipedia.org/wiki/Atmospheric_pressure
[4] Atmosphere of Earth, https://en.wikipedia.org/wiki/Atmosphere_of_Earth
[5] Earth, https://en.wikipedia.org/wiki/Earth
[6] Number of Cattle, https://ourworldindata.org/grapher/cattle-livestock-count-heads?tab= table
[7] World Population, https://worldpopulationreview.com/
[8] Cows and Climate Change https://www.ucdavis.edu/food/news/making-cattle-more-sustainable
[9] Atmospheric Methane, https://en.wikipedia.org/wiki/Atmospheric_methane#:~:text=Atmospheric% 20methane%20is%20the%20methane,the%20most%20potent%20greenhouse%20gases.
[10] Sheep Populations Since 1961, https://pulse.auctionsplus.com.au/aplus-news/insights/ global-flock-versus-export-flock
[11] A. Pelchen and K. J. Peters Methane emissions from sheep, Small Ruminant Research, 26, 137 (1998), https://www.sciencedirect.com/science/article/abs/pii/S092144889700031X? via%3Dihub#preview-section-abstract:~:text=A%20total%20of,on%20methane% 20emissions.
[12] C. A. de Lange, J. D. Ferguson, W. Happer and W. A. van Wijngaarden, “Nitrous Oxide and Climate”, Atmospheric and Oceanic Physics arXiv: 2211.15780 (2022).
[13] Government resets 2050 biogenic methane targets, https://environment.govt.nz/news/govt-resets-2050-biogenic-methane-target/
[14] Stats, NZ, Agricultural production statistics: June 2017 (final) https://www.stats.govt.nz/information-releases/agricultural-production-statistics-june-2017-final/
[15] Le Chatelier’s principle, https://en.wikipedia.org/wiki/Le_Chatelier%27s_principle
These Four CO2 Coalition Members Contributed to this Paper:
W. Happer – Chair of The CO2 Coalition
W. A. van Wijngaarden – CO2 Coalition Member
J. D. Ferguson – CO2 Coalition Member
A. Glatzle -CO2 Coalition Member
Download the pdf here: Livestock, Methane and Climate
Download the Spanish pdf here: Ganado Metano y Clima