Attributing global warming to humans
By Andy May, March 3, 2022
By Andy May
My latest book,[1] just released, is about a climate change debate between Professor David Karoly of the University of Melbourne and Professor William Happer of Princeton, emeritus. One of the most interesting debate topics was about the attribution of global warming. The host was James Barham of TheBestSchools.org. Barham asked David Karoly in his interview: “If increased atmospheric CO2 is not responsible [for global warming], what is?” TheBestSchools notes that skeptics point out several factors that need to be considered before we can reach this conclusion:
- We are, after all, still recovering from the last ice age (in the true sense of the term), which lasted for about 100,000 years and only ended about 12,000 years ago; therefore, why isn’t modest warming simply what we should expect (the null hypothesis) …
- Over the geological record taken as a whole, it appears that warming trends regularly precede rising CO2 levels, not the other way around.
- Some studies show a strong correlation between solar activity cycles and Earth surface temperatures.
Karoly is confident that CO2 and other “greenhouse gases from human activity” are the major cause of observed warming (Karoly, 2021a, p. 23). He points to the AR5 IPCC report. Specifically, he directs us to Figure 10.5,[2] which is our Figure 1.
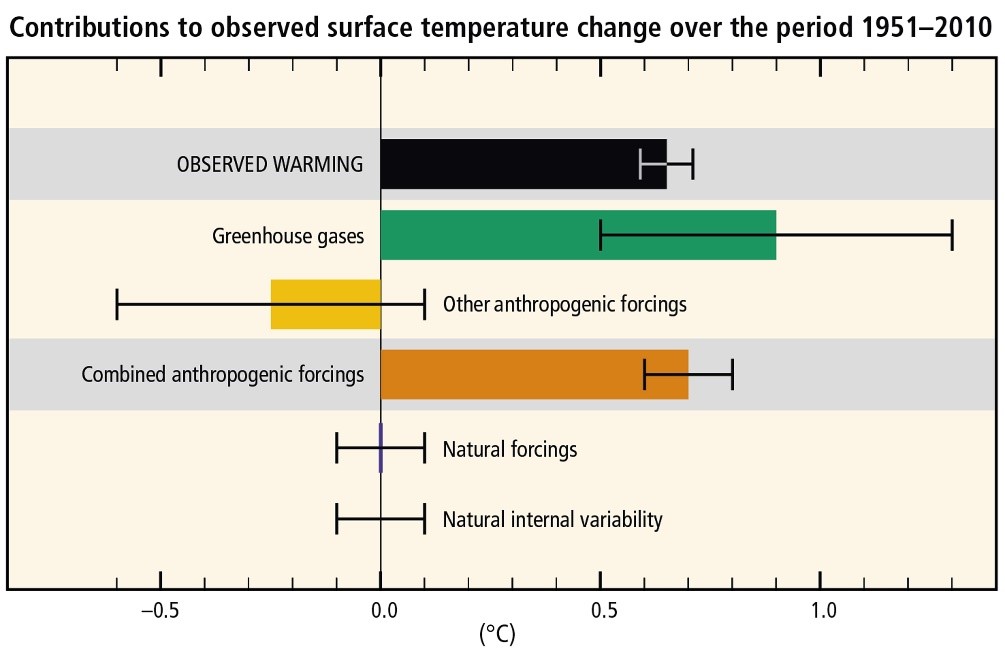
Figure 1. The IPCC modeled ranges for attributable warming trends from 1951 to 2010. Observed warming of about 0.66°C is shown in black. IPCC AR5 (IPCC core writing team, 2014, p. 6).
The IPCC computes the human contribution to climate change with models, nine of the fifteen models are listed on the left of Figure 2. Since the human influence on climate has never been observed or measured, the “climate forcings” plotted in Figures 1 and 2 depend solely upon assumptions built into the models. Figure 1 is a summary of the data and analysis illustrated in Figure 2.
Figure 2 is a portion of IPCC AR5 Figure 10.4 (IPCC, 2013, p. 882). It displays the modeled greenhouse gas (GHG) caused warming, in green. The left panel, panel (a), is scaled in degrees C, and shows the range of modeled changes in temperature, from 1951 to 2010. The bars shown are based on a regression analysis of numerous computer-runs of each model. The individual computer runs systematically change the conditions, for example some runs have little change in CO2 and some have large changes in CO2. The central line in panel (a) is zero change for the analyzed climate forcing.
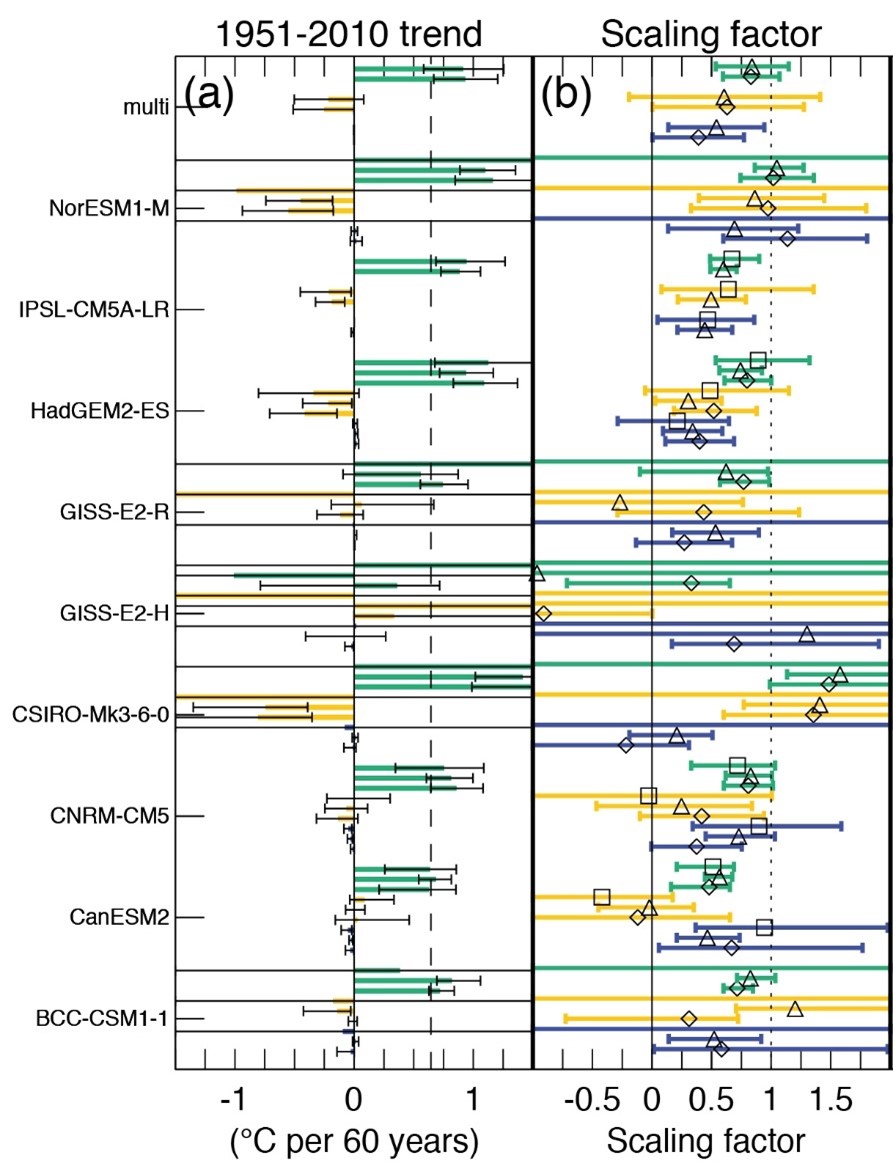
Figure 2. A portion of AR5 Figure 10.4. In panel (a), the green bars are the estimated warming due to GHGs for the model listed to the left. The yellow bars are “other anthropogenic” in Figure 1. The small blue bars are natural forcing. Panel (b) is the scaling factor that must be applied to the model results to match the HadCRUT global temperature dataset. The vertical dashed line in (a) is 0.66°C, the observed warming, and in (b) it is a scaling factor of 1. Source: AR5 (IPCC, 2013, p. 882).
The forcing color schemes in Figures 1 and 2 are the same, so green represents GHG caused changes, yellow is other-anthropogenic, and blue is natural variability. The green bars vary from negative values (GISS-E2-H) to over 1.5°C (GISS-E2-R and H, CSIRO-Mk3-6-0). The other anthropogenic or OA estimates are just as variable. The most likely results from several statistical analyses of model results are shown as black squares, diamonds, and triangles in panel (b).
Panel (b) shows the same data, but as a scaling factor. The scaling factor is the amount each forcing component must be multiplied by to sum to the HadCRUT4 global temperature record. While the proportion of warming caused by each factor is model based, the total warming is thus constrained by the HadCRUT4 record.
This means that the coefficients used to compute AGW (anthropogenic or man-made global warming), and natural warming are computed from model results, not observations. The observations are only a constraint on the total.[3] Nathan Gillett and colleagues observed that some of the 15 models they studied produce very anomalous negative scaling factors, as shown in Figure 2(b). Their statistical assessment of the model results is shown as triangles in Figure 2(b). The negative scaling factors are a result of negative warming coefficients. This means the component is cooling as its forcing increases. They single out model GISS-E2-H and note the model is not “well constrained.”
Figure 2. A portion of AR5 Figure 10.4. In panel (a), the green bars are the estimated warming due to GHGs for the model listed to the left. The yellow bars are “other anthropogenic” in Figure 1. The small blue bars are natural forcing. Panel (b) is the scaling factor that must be applied to the model results to match the HadCRUT global temperature dataset. The vertical dashed line in (a) is 0.66°C, the observed warming, and in (b) it is a scaling factor of 1. Source: AR5 (IPCC, 2013, p. 882).
Gillett, et al. comment that: “The assumption is usually made that a model’s TCR [transient climate response] is proportional to its GHG-induced warming trend over the historical period.” GISS-E2-H especially appears to violate this assumption, but, to a lesser extent most of the models violate it, which concerns Gillett, and colleagues. The models predict about the same warming, but very different TCR values, suggesting something is not quite right in the models. They observe that since the desired result is a multi-model estimate of climate sensitivity, the model’s violation of the assumption should be investigated. Thus, they admit that the connection between GHGs and warming is explicitly assumed, but the model results are not consistent with the assumption. They don’t say it, but it is also possible the models are not accurate.
In Figure 2b the central dashed line is a scaling factor of one, which means the sum of the model components equals the observed (HadCRUT4) warming over the period. Most of the models clearly overestimate warming since most of the component scaling factors are below one. The CSIRO-Mk3-6-0 model is a notable exception.
The interested reader is directed to Gillett, et al. for the details of their statistical analysis of the fifteen climate models in their study. Technically the statistical technique used is called an Empirical Orthogonal Function (EOF) or Principal Components Analysis (PCA). I have no serious problem with their statistical methods, my problem is that it is a study of model results, and unvalidated models at that. Further, why do the scaling factors in Figure 2b, cluster significantly below one?
The top set of results, labeled “multi,” are multi-model-mean values. The multi-model-mean overestimates warming relative to HadCRUT4 for all forcings in Figure 2b. Yet, the IPCC believed it was valid to create it from these diverse values and use the average to “compute” the amount of human-caused global warming. The IPCC summary assessment of the values from all 15 models is what is shown in the tidy Figure 1, the far less tidy Figure 2 is a frightening look under the hood.
Some of the models did not detect any GHG forcing,[4] but most did. An IPCC statistical analysis of the models suggests that: “Overall there is some evidence that some CMIP5 models have a higher transient response to GHGs and a larger response to other anthropogenic forcings … than the real world (medium confidence).”[5] This conclusion agrees with William Happer’s assessment of the models.
Figure 2 shows the same thing. Most of the scaling factors, for the nine models shown, are below unity, and some are negative. These models are clearly overestimating warming due to GHGs.
Figure 2 shows an exceptionally large variation in the computed greenhouse effect. The range of computed (or modeled) greenhouse gas warming from 1951 to 2010 is larger than the total observed warming of 0.66°C, the dashed line in panel (a). This does not give us confidence in the values plotted in Figure 1 or in the models.
Averages, especially global averages, hide a lot of critical detail. Nathan Gillett and colleague’s 2013 paper is a major source in AR5’s Chapter 10. Gillett is a coauthor of Chapter 10, and his 2013 paper is cited 25 times in the chapter. He and his coauthors have the following to say about the assumptions they made to attribute recent warming to human “carbon” emissions:
“Because TCRE [the transient climate response to cumulative CO2 emissions] depends both on the carbon cycle and on the physical climate system, constraining it with observations requires both carbon cycle and temperature observations. … the most direct approach is to first use surface temperature observations to derive an estimate of CO2-attributable warming to the present and then divide this by an estimate of cumulative CO2 emissions. Estimating TCRE in this way relies on the assumption that TCRE is constant as a function of cumulative emissions between present day cumulative emissions and cumulative emissions at CO2 doubling. … Note that we estimate CO2-attributable warming using a fit to 150 yr of temperature observations … Because the historical increases in radiative forcings associated with aerosols and non-CO2 greenhouse gases have approximately cancelled each other out and large trends in volcanic and solar forcings have not occurred over this period, CO2 concentration changes caused by the temperature response to non-CO2 forcings are probably small.”
Let me translate. First, we assume that TCRE is a constant function of cumulative CO2 emissions, then we compare the 150-year records of CO2 emissions to the surface temperature record over the same period. We assume that aerosols and the other greenhouse gases cancel each other and that all solar and volcanic forcings are insignificant. Thus, they assume that CO2 emissions are the only significant influence on climate and then find that CO2 is the only significant influence on climate, big surprise!
This is just one example of the circular “proof” that CO2 emissions drive climate change, there are many others. There is no evidence, other than models, that human CO2 emissions drive climate change and abundant evidence that the Sun, coupled with natural climate cycles, drives most, if not all, of recent climate changes, as described in Connolly, et al., 2021.[6]
The bulk of this post is from my latest book, The Great Climate Debate, Karoly v Happer, it can be purchased on Amazon.com and BarnesandNoble.com. If you buy it and read it, please leave a favorable review at one or both of the sites, if not, mark the favorable reviews as “helpful,” that counts also.
The bibliography can be downloaded here.
- (May, 2022) ↑
- on page 884 in Chapter 10 of AR5 ↑
- (Gillett et al., 2013) and (IPCC, 2013, p. 882) ↑
- (IPCC, 2013, p. 882) ↑
- (IPCC, 2013, p. 884) ↑
- (Connolly et al., 2021): “How much has the Sun influenced Northern Hemisphere temperature trends? An ongoing debate.” Existing data show that the Sun could explain anywhere from zero to 100% of recent warming. ↑
The featured cartoon is by Josh, who graciously gave me permission to use it, his website is here. This cartoon is in Josh’s 2022 calendar, I think he still has a few to sell.
Andy May is a retired petrophysicist and developmental geologist, science writer, President of the Center for the Study of Carbon Dioxide and Global Change and a proud member of the CO2 Coalition.