Holocene CO2 Variability and Underlying Trends
Renee Hannon – October 29, 2021
Introduction
This post compares CO2 data from Antarctic ice cores during the Holocene interglacial period with other publicly available CO2 datasets. Antarctic CO2 is regarded as the gold standard for paleo-atmospheric global CO2 during past interglacial and glacial periods. Antarctic CO2 data does capture the multi-millennial underlying trend; however, short-term centennial trends are not evident. By examining a wider range of CO2 data such as Greenland ice and stomata, a more complete picture of past centennial CO2 fluctuations emerges.
Antarctic Ice CO2 Composite Understates CO2
My last post here focused on CO2 data from Antarctic ice cores. To summarize, the global CO2 composite by Bereiter, 2014, is based on three Antarctic ice cores over the Holocene: Law Dome, EPICA Dome C and shifted WAIS. CO2 shows a strong millennial correlation with Antarctic climate suggesting influence of the Southern Ocean circulation (Bauska, 2015, Ahn, 2012, Siegenthaler, 2005 Marcott, 2014). The global CO2 composite consistently reads 260-280 ppm across the Holocene interglacial period. However, shorter term events such as the 8.2 kyr cold event is not captured by a decrease in CO2 and the Younger Dyras (YD) is not very pronounced.
If all public Antarctic data is plotted, there is more scatter of CO2 values up to 25 ppm with an average of 7 ppm shown in Figure 1. The largest amount of scatter appears at the end of deglaciation and on the shoulder of the Early Holocene interglacial from 10,500 to 11,500 years BP. This shoulder represents a period of climate instability as the climate transitioned out of the colder Younger-Dryas (YD). These unstable CO2 conditions lasted for about 1000 years. Relatively stable CO2 climatic conditions occur after the CO2 minimum around 8000 years BP where CO2 scatter between ice cores is minimal. The scatter in CO2 over the past 1000 years suggests a return to less stable climate conditions.
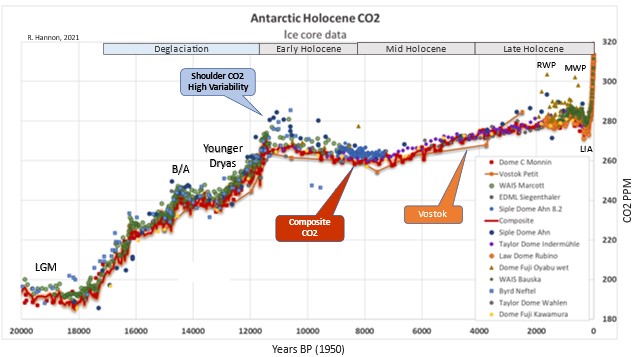
Figure 1: Antarctic datasets compared to the Antarctic CO2 composite (red line). Vostok CO2 data highlighted in orange. Note color coding of high resolution in blues and greens, and lower resolution in red, orange and yellows. Dome Fuji wet extraction added. Time scale is AICC2012. Taylor and Siple Dome shifted by 250 years to fit new time scale. B/A is the Bolling Allerod and LGM is the Last Glacial Maximum. References shown on graph.
A key observation is that the Antarctic global composite highlighted in red underestimates CO2 values during the early Holocene and perhaps the dynamic behavior of CO2. The widely used composite has lower CO2 readings than other Antarctic datasets by up to 20 ppm. Vostok is also highlighted by an orange line as it is the other CO2 dataset frequently used for past paleoclimate interglacial comparisons. The Vostok CO2 data is even more muted but does captures the long-term millennium trend.
There are two very different processes that impact ice core CO2 data resolution. One is related to gas smoothing during snow densification and the other is simply sample spacing.
Gas smoothing due to the firn to snow transition is site dependent and related to snow accumulation and temperature. Dome C and Vostok ice core sites have low snow accumulation rates and extremely low temperatures resulting in the lowest temporal resolution records. CO2 at these sites is averaged or smoothed over hundreds of years. This smoothing effect removes high frequency variations from the ice core record. High snow accumulation sites include Law Dome, Siple Dome, Byrd and WAIS where CO2 is only smoothed over tens of years. These ice core records show deviations from the CO2 composite and higher CO2 variability in the early and late Holocene.
Sample spacing resolution is a problem that is frequently overlooked and/or not addressed. The higher temporal resolution Byrd and Siple Dome CO2 data have a sparse sample spacing of 200 to 400 years over the Holocene. Ironically, the lowest temporal resolution records of Dome C have the highest sample frequency of about 100 years. Increased sampling of low snow accumulation sites with low temporal resolution will not increase the data resolution.
In summary, reduced temporal resolution due to firn densification processes and low sample frequency can explain elevated Antarctic ice CO2 levels not captured by Dome C and Vostok but are displayed in Law Dome, Siple Dome, Bryd and WAIS.
Greenland Ice CO2 Shows Higher Variability than Antarctic Ice CO2
CO2 measurements from Greenland ice cores are assumed to be unreliable due to in situ production of CO2 by carbonate-acid reactions and oxidation of organic compounds (Anklin 1995, Barnola 1995, and Tschumi 2000). CO2 concentrations in Greenland range up to 20-30 ppm higher than the Antarctic CO2 composite and show more variability with standard deviations of 6-10 ppm compared to 2-3 ppm in Antarctic ice cores.
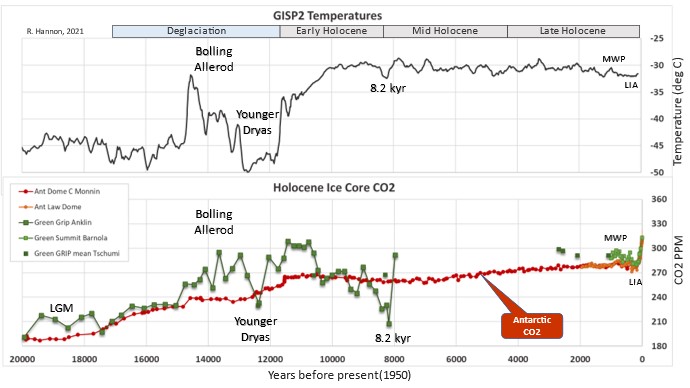
Figure 2 shows Greenland ice core temperature proxies from oxygen isotopes and CO2 compared to Antarctic ice CO2. Public Greenland ice CO2 data is limited to a few sections within the Holocene; over the past several 1000 years and from 8000 years BP into the last glacial period.
During the Little Ice Age (LIA) and Modern CO2 rise, Greenland ice CO2 shows good agreement with Antarctic ice CO2. Greenland CO2 shows an increase up to about 300 ppm during the MWP that is not captured in the Antarctic composite CO2 data. However, other Antarctic datasets show quite a bit of scatter during this time shown in Figure 2.
Scherelis, 2017, found similar CO2 increases in the Greenland Tunu ice records over the past 1000 years. She conducted a detailed chemistry analysis of the ice core and could not find evidence of chemical reactions, a surprising outcome. “Our study shows that the Greenland ice core record is in fact not as bad for CO2 measurements, compared to WAIS Divide record, as expected. Our results also show that there is no significant increase or decrease in excess CO2 at the peaks in the chemistry data. With no large difference in the excess CO2, the source of contamination may not be due to oxidation and dissolution processes in the ice, which is not what we predicted.”
The other interesting response of CO2 from Greenland ice cores is during the colder centennial 8.2 kyr and Younger Dryas events. Greenland CO2 decreases 50 ppm below the Antarctic CO2 composite during the 8.2 kyr event shown in Figure 3. Antarctic CO2 data does not even recognize the 8.2 kyr event and shows a gradual decrease during the entire glaciation stage. No theories are published as to why Greenland CO2 is depleted or lower than Antarctic CO2 during cooling events.
Stomata CO2 Demonstrates Short-term Variability
Stomata from plants are used as a CO2 proxy for paleo-atmospheric CO2 reconstructions (Jessen, 2005; Wagner, 2004). Basically, CO2 enters through a plant leaf’s stomata or tiny pores. When CO2 in the atmosphere increases, plants have fewer stomata. When atmospheric CO2 decreases, stomata in plants increase to compensate for low CO2 levels. Scientists count the number of stomata on different plant species known as the stomata density (number of stomata per area). A more accurate measure is the stomata index (number of stomata proportional to the sum of stromata and epidermal cells) used to minimize the influence of local environmental variables. The stomatal index is also calibrated with modern training sets to calculate the sensitivity to atmospheric CO2 levels.
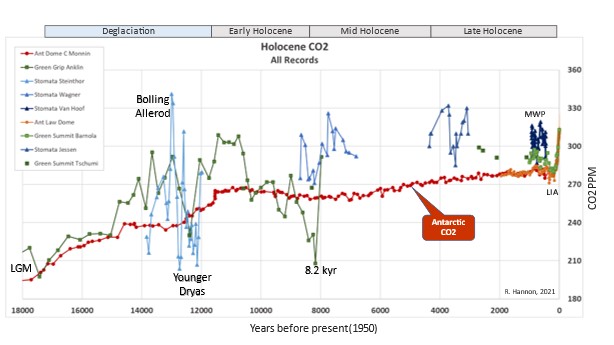
Figure 3: Stomata CO2 data compared to Greenland CO2 and Antarctic CO2 (red line). Note color coding of stomata CO2 in blues, Greenland ice core CO2 in greens, and lower resolution Antarctic CO2 in reds and orange. References shown on graph. Data normalized to approximately 20 years during the Late Holocene and 100 years during the Mid-Early Holocene and deglaciation.
Figure 3 shows CO2 data from four different stomata studies during the Holocene. Both Greenland and Antarctic ice CO2 are presented for comparison. Stomata CO2 shows high variability during the Holocene during short time intervals. For example, stomata CO2 averages around 305 ppm with oscillations of 30 to 50 ppm and a standard deviation of 10 to 15 ppm during the Holocene. The duration of the oscillations around the mean ranges from 100 to 600 years.
Wagner, 2004, demonstrated CO2 from stomata obtained from different continents and plant species show highly comparable fluctuations during the Younger Dryas, the 8.2 kyr cooling event and the LIA. He states that the agreement of the stomatal frequency records is Northern Hemispheric in nature and not a local continental signature.
Data quality of CO2 proxy from stomata is similar to using tree rings for paleo-temperatures. Both tend to have higher frequency and shorter time series. They can also retain local signatures that may not be global in nature, although use of the stomata index is supposed to standardize local environmental conditions. However, scientists extensively use tree rings, pollen, and corals as well as ice cores for global paleo-temperature reconstructions. For technical completeness, scientists should consider stomata short-term variability in paleo-CO2 atmospheric reconstructions.
Holocene CO2 Centennial Versus Millennial Trends
Figure 4 shows the statistics of the various CO2 datasets during key Holocene and deglaciation events. The Antarctic global CO2 composite shows a stable trend averaging 275 ppm with no centennial variation during Holocene and low standard deviations of 5 ppm or less. However, higher accumulation Antarctic ice sites shows CO2 is generally 4-20 ppm higher than the global CO2 composite.
Greenland ice and stomata CO2 data do not support the relative stability and lack of centennial variability in Antarctic CO2 data. What’s interesting is that Greenland ice cores and stomata CO2 data tend to show good agreement. They have a higher average CO2 during the Holocene than Antarctic (~300 versus 275 ppm). Both Greenland ice and stromata CO2 recognize dips during the cooler YD and 8.2 kyr events not observed in Antarctic data. These dips are also present within methane data (not shown) suggesting a covariation between CO2 and CH4. Greenland ice and stomata CO2 show centennial variability ranges of 30 to 100 ppm over durations of 100 to 600 years. These variations are comparable to the modern warm period where CO2 has increased by 100 ppm over the past century.
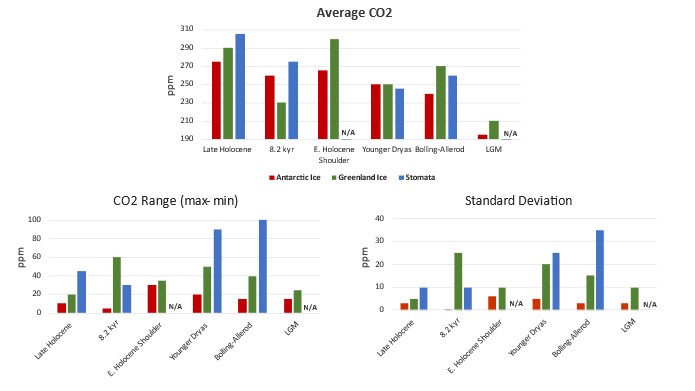
Figure 4: Statistics for various CO2 data sets during key Holocene and deglaciation events.
Exclusion of high temporal resolution records combined with sparse sampling produces an incomplete picture of past CO2 variability. Utilizing CO2 data that records short-term variability, as well as longer-term millennial trends, is essential to understand the Modern centennial increase. Since these centennial CO2 variations are not observed in Antarctic data, stomata and Greenland CO2 may indicate an additional mode of carbon cycle variability such as abrupt changes in Northern Hemisphere processes. These vastly different records suggest Northern terrestrial and oceanic sources work in conjunction with and/or are driven by millennial Southern Ocean process.
Ice core and stomata CO2 records are imperfect data and therefore, the global CO2 composite should be inclusive of both centennial and millennial scale deterministic measurements. Perhaps it’s the Antarctic global CO2 composite that is the outlier, suppressed smoothed and muted by extreme Antarctic temperatures and burial conditions. And the centennial Modern CO2 increase is not that unique.
References Cited
Antarctic Ice Cores
Ahn J, and J. Brook, Atmospheric CO2 over the last 1000 years: A high-resolution record from the West Antarctic Ice Sheet (WAIS) Divide ice core, Global Biogeochemical Cycles/Volume 26, issue 2, 2012.
Ahn J., Martin Wahlen, Bruce L. Deck, Ed J. Brook, Paul A. Mayewski, Kendrick C. Taylor, James W. C. White, A record of atmospheric CO2 during the last 40,000 years from the Siple Dome, Antarctica ice core. 15 July 2004. AGU. https://doi.org/10.1029/2003JD004415.
Ahn, J., E.J. Brook, and C. Buizert, Response of atmospheric CO2 to the abrupt cooling event 8200 years ago, Geophys. Res. Lett., doi:10.1002/2013GL058177 (2014).
Anklin, M., J. Schwander, B. Stauffer, J. Tschumi, A. Fuchs, J.M. Bamola, and D. Raynaud, CO2 record between 40 and 8 kyr B.P. from the Greenland ice core project ice core, J Geophys. Res., 102 (CI2), 26539-26546, 1997.
Alley, R.B. 2004. GISP2 Ice Core Temperature and Accumulation Data. IGBP PAGES/World Data Center for Paleoclimatology
Data Contribution Series #2004-013. ftp://ftp.ncdc.noaa.gov/pub/data/paleo/icecore/greenland/summit/gisp2/isotopes/gisp2_temp_accum_alley2000.txt
Bauska, T.K.; Joos, F.; Mix, A.C.; Roth, R.; Ahn, J.; Brook, E.J., WAIS Divide Ice Core 1,200 Year Atmospheric CO2 and d13CO2 Data, 2015. ftp://ftp.ncdc.noaa.gov/pub/data/paleo/icecore/antarctica/wais2015co2.txt
Bereiter et al. (2014), Revision of the EPICA Dome C CO2 record from 800 to 600 kyr before present, Geophysical Research Letters, doi: 10.1002/2014GL061957. https://www1.ncdc.noaa.gov/pub/data/paleo/icecore/antarctica/antarctica2015co2.xls. Note, IPCC AR6 references Bereiter et al (2015), pretty sure its 2014 not 2015.
Indermuhle, A., T. F. Stocker, F. Joos, H. Fischer, H. J. Smith, M. Wahlen, B. Deck, D. Mastroianni, J. Tschumi, T. Blunier, R. Meyer & B. Stauffer, Holocene carbon-cycle dynamics based on CO2 trapped in ice at Taylor Dome, Antarctica. NATURE | VOL 398 | 11 MARCH 1999.
Kawamura, K., F. Parrenin, L. Lisiecki, R. Uemura, F. Vimeux, J.P. Severinghaus, M. A. Hutterli, T. Nakazawa, S. Aoki, J. Jouzel, M. E. Raymo, K. Matsumoto, H. Nakata, H. Motoyama, S. Fujita, K. Goto-Azuma, Y. Fujii, and O. Watanabe. 2007. Northern Hemisphere forcing of climatic cycles in Antarctica over the past 360,000 years. Nature, Vol. 448, pp. 912-916. doi:10.1038/nature06015.
Marcott, S. A., Bauska, T. K., Buizert, C., Steig, E. J., Rosen, J. L., Cuffey, K. M., Fudge, T. J., Severinghaus, J. P., Ahn, J., Kalk, M. L., McConnell, J. R., Sowers, T., Taylor, K. C., White, J. W. C., and Brook, E. J.: Centennial-scale changes in the global carbon cycle during the last deglaciation, Nature, 514, 616–619, https://doi.org/10.1038/nature13799, 2014.
Neftel, A., H. Friedli, E. Moor, H. Lötscher, H. Oeschger, U. Siegenthaler, B. Stauffer: Historical Carbon Dioxide Record from the Siple Station Ice Core. 1994. https://cdiac.ess-dive.lbl.gov/trends/co2/siple.html
Oyabu, I., Kawamura, K., Kitamura, K., Dallmayr, R., Kitamura, A., Sawada, C., Severinghaus, J. P., Beaudette, R., Sugawara, S., Ishidoya, S., Dahl-Jensen, D., Goto-Azuma, K., Aoki, S., Nakazawa, New technique for high-precision, simultaneous measurements of CH4, N2O and CO2 concentrations; isotopic and elemental ratios of N2, O2 and Ar; and total air content in ice cores by wet extraction. 2020-12-15, https://amt.copernicus.org/articles/13/6703/2020.
Rubino, M., Etheridge, D. M., Thornton, D. P., Howden, R., Allison, C. E., Francey, R. J., Langenfelds, R. L., Steele, L. P., Trudinger, C. M., Spencer, D. A., Curran, M. A. J., van Ommen, T. D., and Smith, A. M.: Revised records of atmospheric trace gases CO2, CH4, N2O, and δ13C-CO2 over the last 2000 years from Law Dome, Antarctica, Earth Syst. Sci. Data, 11, 473–492, https://doi.org/10.5194/essd-11-473-2019, 2019.
Siegenthaler, U. et. al. EPICA Dronning Maud Land CO2 Data for the Last Millennium, 2005. https://www1.ncdc.noaa.gov/pub/data/paleo/icecore/antarctica/maud/edml-co2-2005.txt
Greenland Ice Core References
Anklin, M., J. Schwander, B. Stauffer, J. Tschumi, A. Fuchs, J.M. Bamola, and D. Raynaud, CO2 record between 40 and 8 kyr B.P. from the Greenland ice core project ice core, J Geophys. Res., 102 (CI2), 26539-26546, 1997.
Barnola, J.-M., M. Anklin, l Porcheron, D. Raynaud, l Schwander, and B. Stauffer, CO2 evolution during the last millennium as recorded by Antarctic and Greenland ice, Tellus, 47B, 264-272, 1995.
Scherelis, Victoria. An investigation of the fidelity of records of past carbon dioxide variations in Greenland ice cores. Poster session. CEOAS, Oregon State University, Covallis, Oregon. 2017.
- Tschumi and B.Stauffer, Reconstructing of the past atmospheric CO2 concentrations based on ice-core analyses: open questions due to in situ production of CO2 in the ice. Cambridge University Press: 2000.
Stomatal References
Jessen, C. A., Rundgren, M., Bjo ̈ rck, S. and Hammarlund, D. 2005. Abrupt climatic changes and an unstable transition into a late Holocene Thermal Decline: a multiproxy record from southern Sweden. J. Quaternary Sci., Vol. 20 pp. 349–362. ISSN 0267-8179.
Steinthorsdottir, M. Barbara Wohlfarth, Malin E.Kylander, Maarten Blaauw, Paula J.Reimer. Stomatal proxy record of CO2 concentrations from the last termination suggests an important role for CO2 at climate change transitions. Quaternary Science Reviews, Volume 68, 15 May 2013, Pages 43-58.
Van Hoof, Thomas, Friederike Wagner-Cremer, Wolfram M. Kürschner, and Henk Visscher. A role for atmospheric CO2 in preindustrial climate forcing. PNAS October 14, 2008 105 (41) 15815-15818; https://doi.org/10.1073/pnas.0807624105.
Wagner, Friederike, Bent Aaby, and Henk Visscher. Rapid atmospheric CO2 changes associated with the 8,200-years-B.P. cooling event. PNAS September 17, 2002 99 (19) 12011-12014; https://doi.org/10.1073/pnas.182420699.
Wagner F, Kouwenberg LLR, van Hoof TB, Visscher H (2004) Reproducibility of Holocene atmospheric CO2 records based on stomatal frequency. Quat Sci Rev 23:1947–1954.