Is the COVID-19 Economic Downturn Affecting Atmospheric CO2? Mauna Loa Data Say, Not Yet
Some global warming alarmists are celebrating the current economic downturn as just what is needed to avert climate catastrophe. I’ve seen a couple estimates that China’s manufacturing and commerce might have seen up at 40% reduction recently.
The current global crisis will be a test of just how much economic pain is required to substantially reduce CO2 emissions (assuming there is no reasonably affordable and practical replacement for fossil fuels).
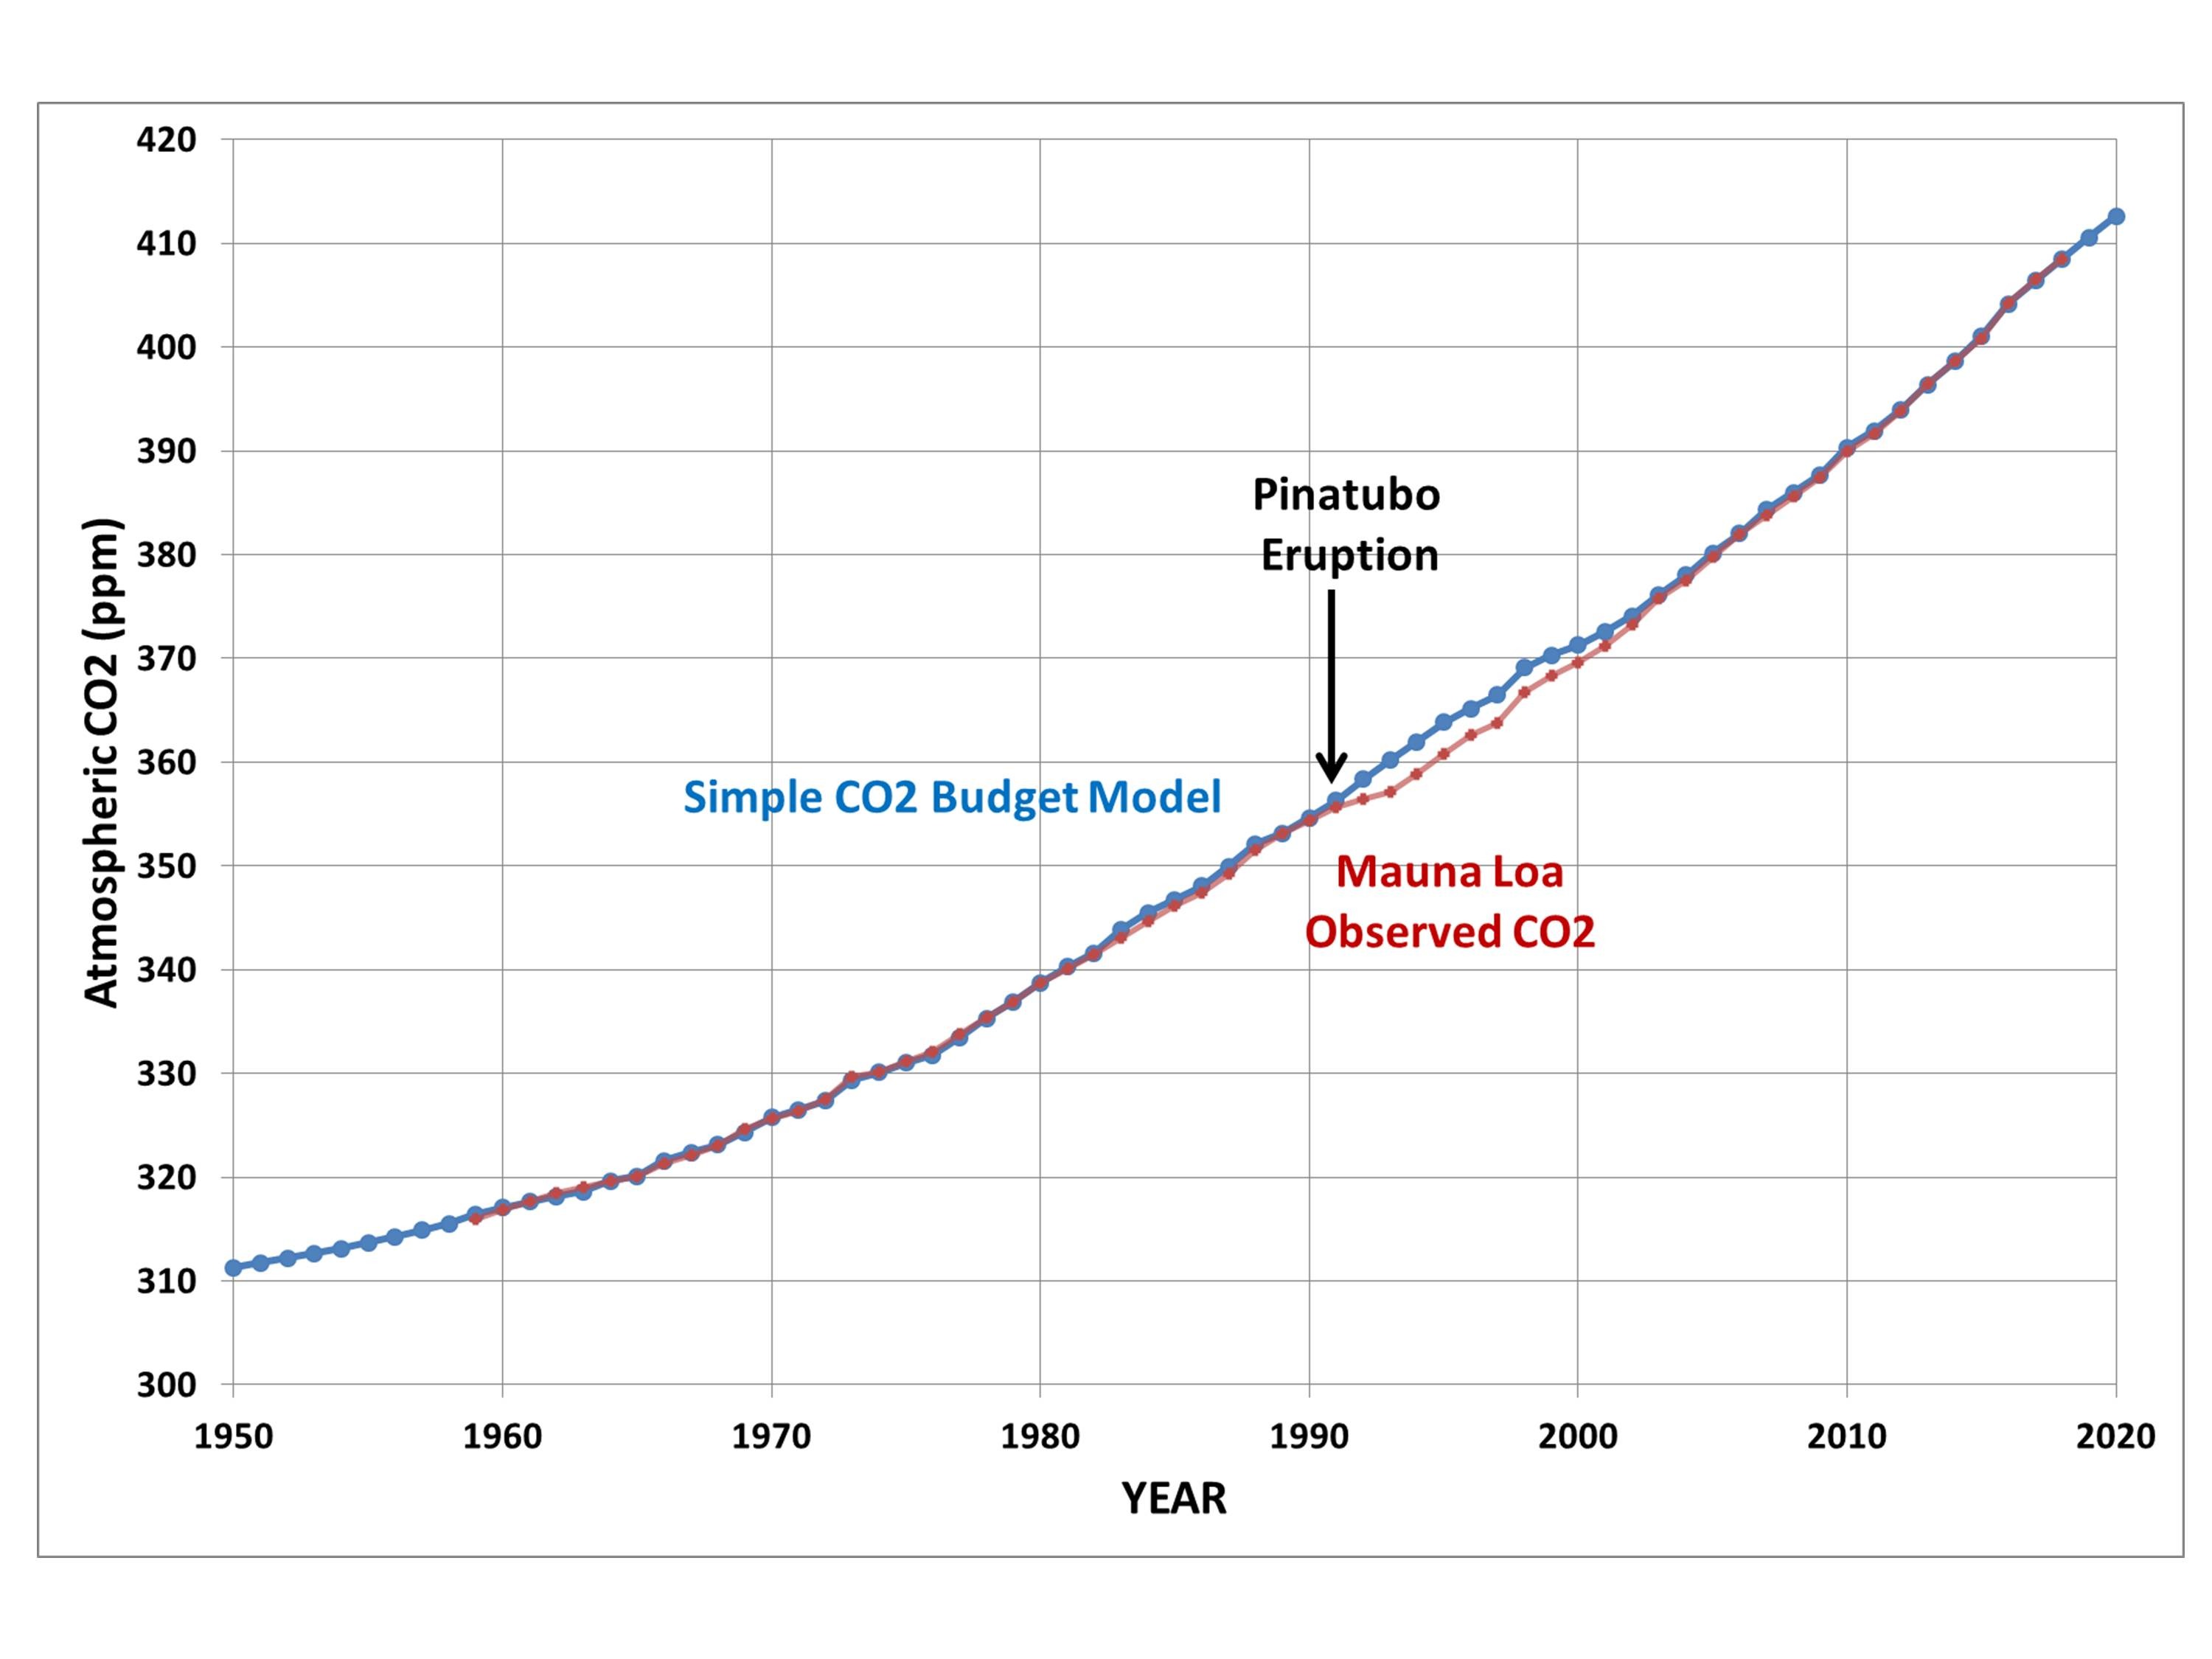
I already know that some of my “deep skeptic” acquaintances (you know who you are) who believe the global CO2 increase is mostly natural will claim a continuing CO2 rise in the face of a decrease in economic activity supports their case. I have previously shown that a simple model of the CO2 variations since 1959 forced with anthropogenic emissions accurately explain the Mauna Loa observations (see Fig. 2 , explanation here). It will take considerable evidence to convince me that the long-term rise is not anthropogenic, and maybe the current “coronavirus experiment” will provide some contrarian evidence.
Of course, for anthropogenic CO2 emissions reductions to have any effect, they actually have to show up in the atmosphere. The most widely cited monitoring location for CO2 is on Mauna Loa in Hawaii. It is at high elevation in a persistent subtropical high pressure zone that should be able to detect large emissions changes in several weeks time as weather systems move around the world.
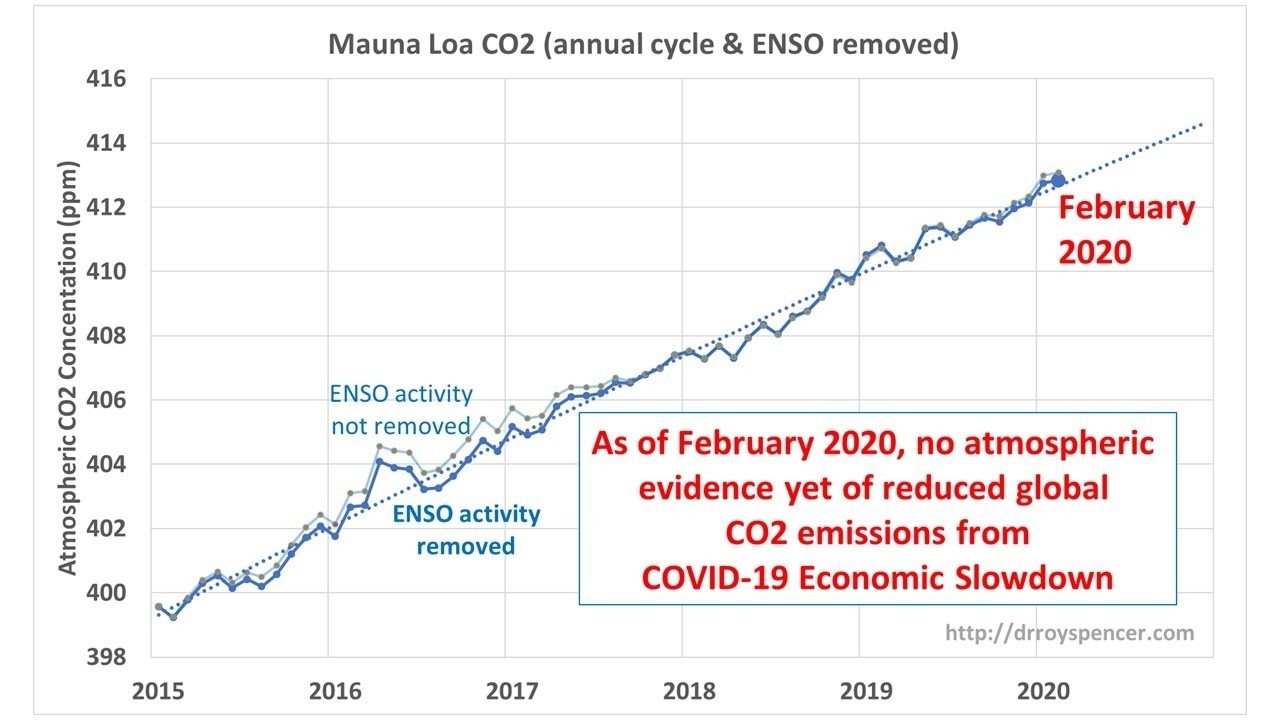
I’ve had several requests, and seen numerous social media comments, suggesting this is something that should be looked at. So, I’ve analyzed the Mauna Loa CO2 data (updated monthly) through February 2020 to see if there is any hint of a CO2 concentration downturn (or, more accurately, reduced rate of rise).
The short answer is: No… at least not yet.
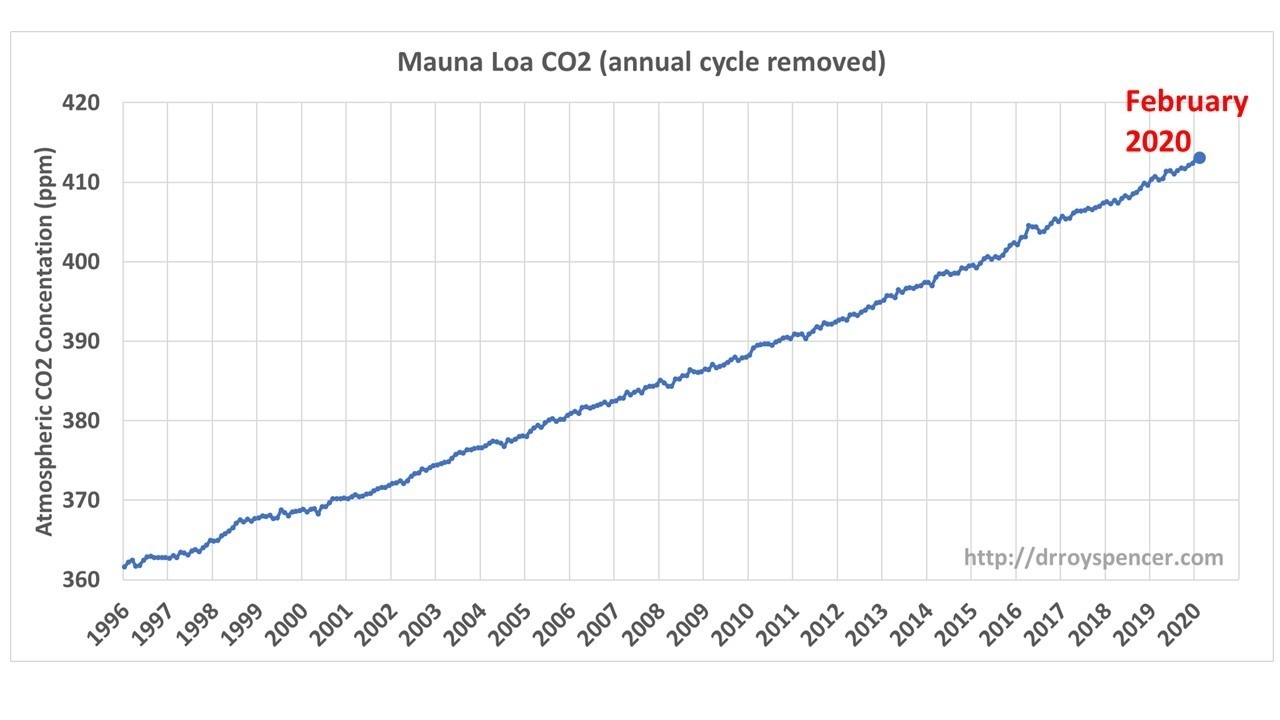
The Mauna Loa Data: Removing Seasonal and ENSO Effects
While an anthropogenic source of CO2 can explain the long-term rise in CO2, the trouble with finding an anthropogenic signal on time scale of a few months to a couple years is that natural variations swamp any anthropogenic changes on short time scales.
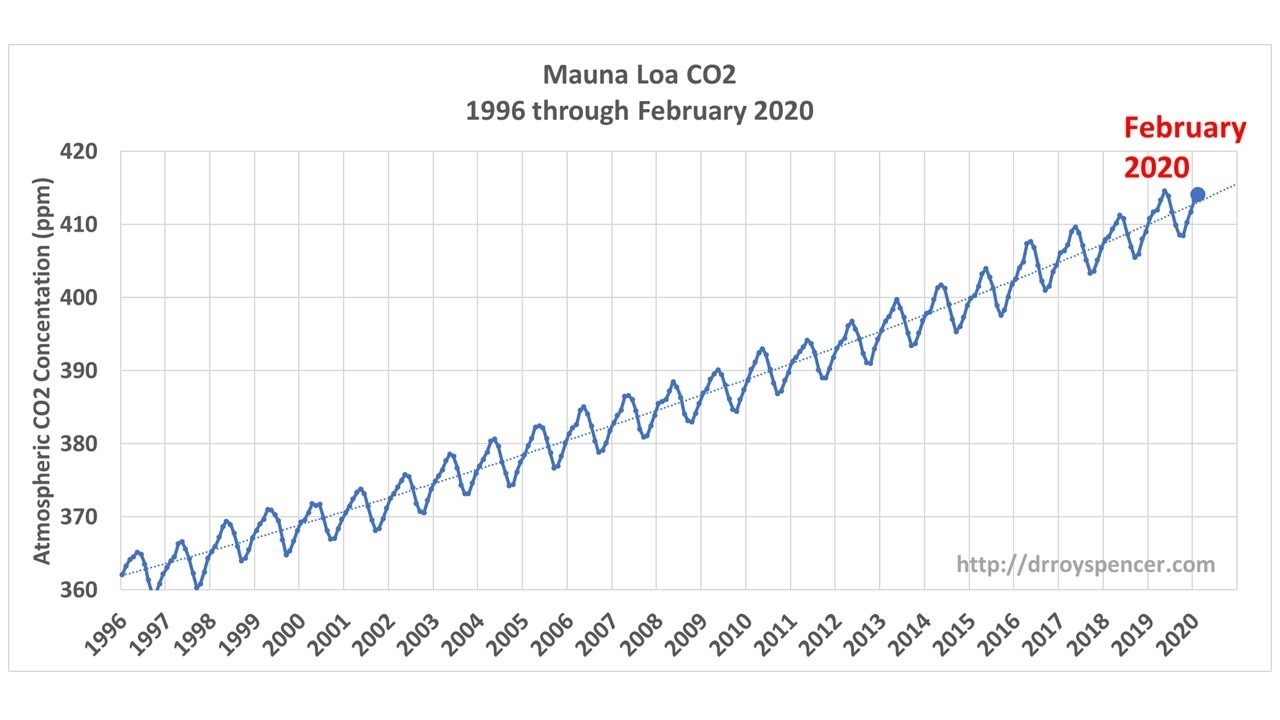
The monthly data (arbitrarily starting 1996, below) shows a continuing long-term rise that has been occurring since monitoring began in 1958. Also seen is the strong seasonal cycle as the vegetation in the Northern Hemisphere goes through its normal seasonal variations in growth and decay.