Facebook’s ‘Fact Checks’ Suppress Debate
By Steven E. Koonin
This paper published Mark Mills’s review of “Unsettled,” my book on climate science, on April 25. Eight days later, 11 self-appointed “fact checkers” weighed in with a 4,500-word critique on the website ClimateFeedback.org. Facebook is waving that fact check as a giant red flag whenever the review appears in anyone’s feed.
By branding Mr. Mills’s review with “very low scientific credibility,” the company directs its billions of users to a website that claims to discredit the review and, by direct implication, my book. This action adds to the growing suppression of open discussion of climate complexities.
ClimateFeedback bills itself as “a worldwide network of scientists sorting fact from fiction in climate change media coverage.” Its modus operandi is to label necessarily brief media statements as misleading or inaccurate, often because they lack context. While acknowledging that “global crop yields are rising,” for instance, they add the untestable claim that yields might have been greater absent human-caused climate change. The gang of enforcers who “fact checked” Mr. Mills’s review included professors from Stanford, UCLA and MIT.
The oddest element of Facebook’s action is that the “fact check” doesn’t challenge anything I wrote in “Unsettled,” but rather provides “context” for Mr. Mills’s statements.
The “fact checkers’ ” motivation is apparent in their criticism of a statement about extreme weather events. Two of three fact-checking contributors, Daniel Swain and Andreas Prein, acknowledge that “tornado frequency and severity are also not trending up; nor are the number and severity of droughts,” and go on to explain why it might not be true in the future, as I do in “Unsettled.” Highlighting the absence of global trends in most types of severe weather is a rebuttal of the widespread claim that the climate is “broken.” But another contributor, Kerry Emanuel, an MIT professor who hasn’t read my book, disapproves of the statement because “it sets up a strawman” to disparage climate predictions. It seems Mr. Emanuel would allow media to discuss only deleterious climate trends.
Thoughtful challenge and dialogue are the most powerful ways that science gets closer to truth. But Facebook’s “fact checkers” criticized what they imagined I wrote based on a 900-word review, rather than what I did write in a book of more than 75,000 words. They’re no better than trolls who pan political adversaries’ books on Amazon without bothering to read them. It’s not the behavior of serious scientists, and it demonstrates the need for a book like “Unsettled.”
Wise responses to the changing climate require that we get the unfiltered certainties and uncertainties of climate science into the public dialogue. As most fair-minded people will discover, there is far more unsettled in the official United Nations and U.S. government reports than we have been led to believe. It doesn’t help to have Facebook spreading disinformation under the guise of “fact checking.”
This article appeared on the Wall Street Journal website at https://steven-koonin.medium.com/response-to-climate-feedbacks-fact-check-of-mark-mills-wall-street-16b9742fe35a
Mr. Koonin is author of “Unsettled: What Climate Science Tells Us, What It Doesn’t, and Why It Matters.” His detailed response to the “fact check” appears here and below:
A bad check of climate facts
This document is a detailed response to Climate Feedback’s “fact check” of Mark Mills’ Wall Street Journal review of my book, Unsettled. An OpEd published in the physical Journal on May 17, 2021 provides a high-level summary of the situation. There follows below a point-by-point response to Climate Feedback’s “fact check”. Each of the “checks” is copied directly from the Climate Feedback website. They are separated by a line
__________________________________________________________
and
shown as quoted text.
My responses are interspersed in normal text and begin with “Response”. I have not responded to the general criticisms made, which in any event rely on these detailed points.
”Greenland’s ice sheet isn’t shrinking any more rapidly today than it was eighty years ago.”
Twila Moon, Research Scientist, University of Colorado, Boulder:
This statement is untrue. In fact, the Greenland Ice Sheet lost more mass during 2003–2010 than during all of 1900–2003 combined. This is evident in the following figure from Kjeldsen et al.[1]
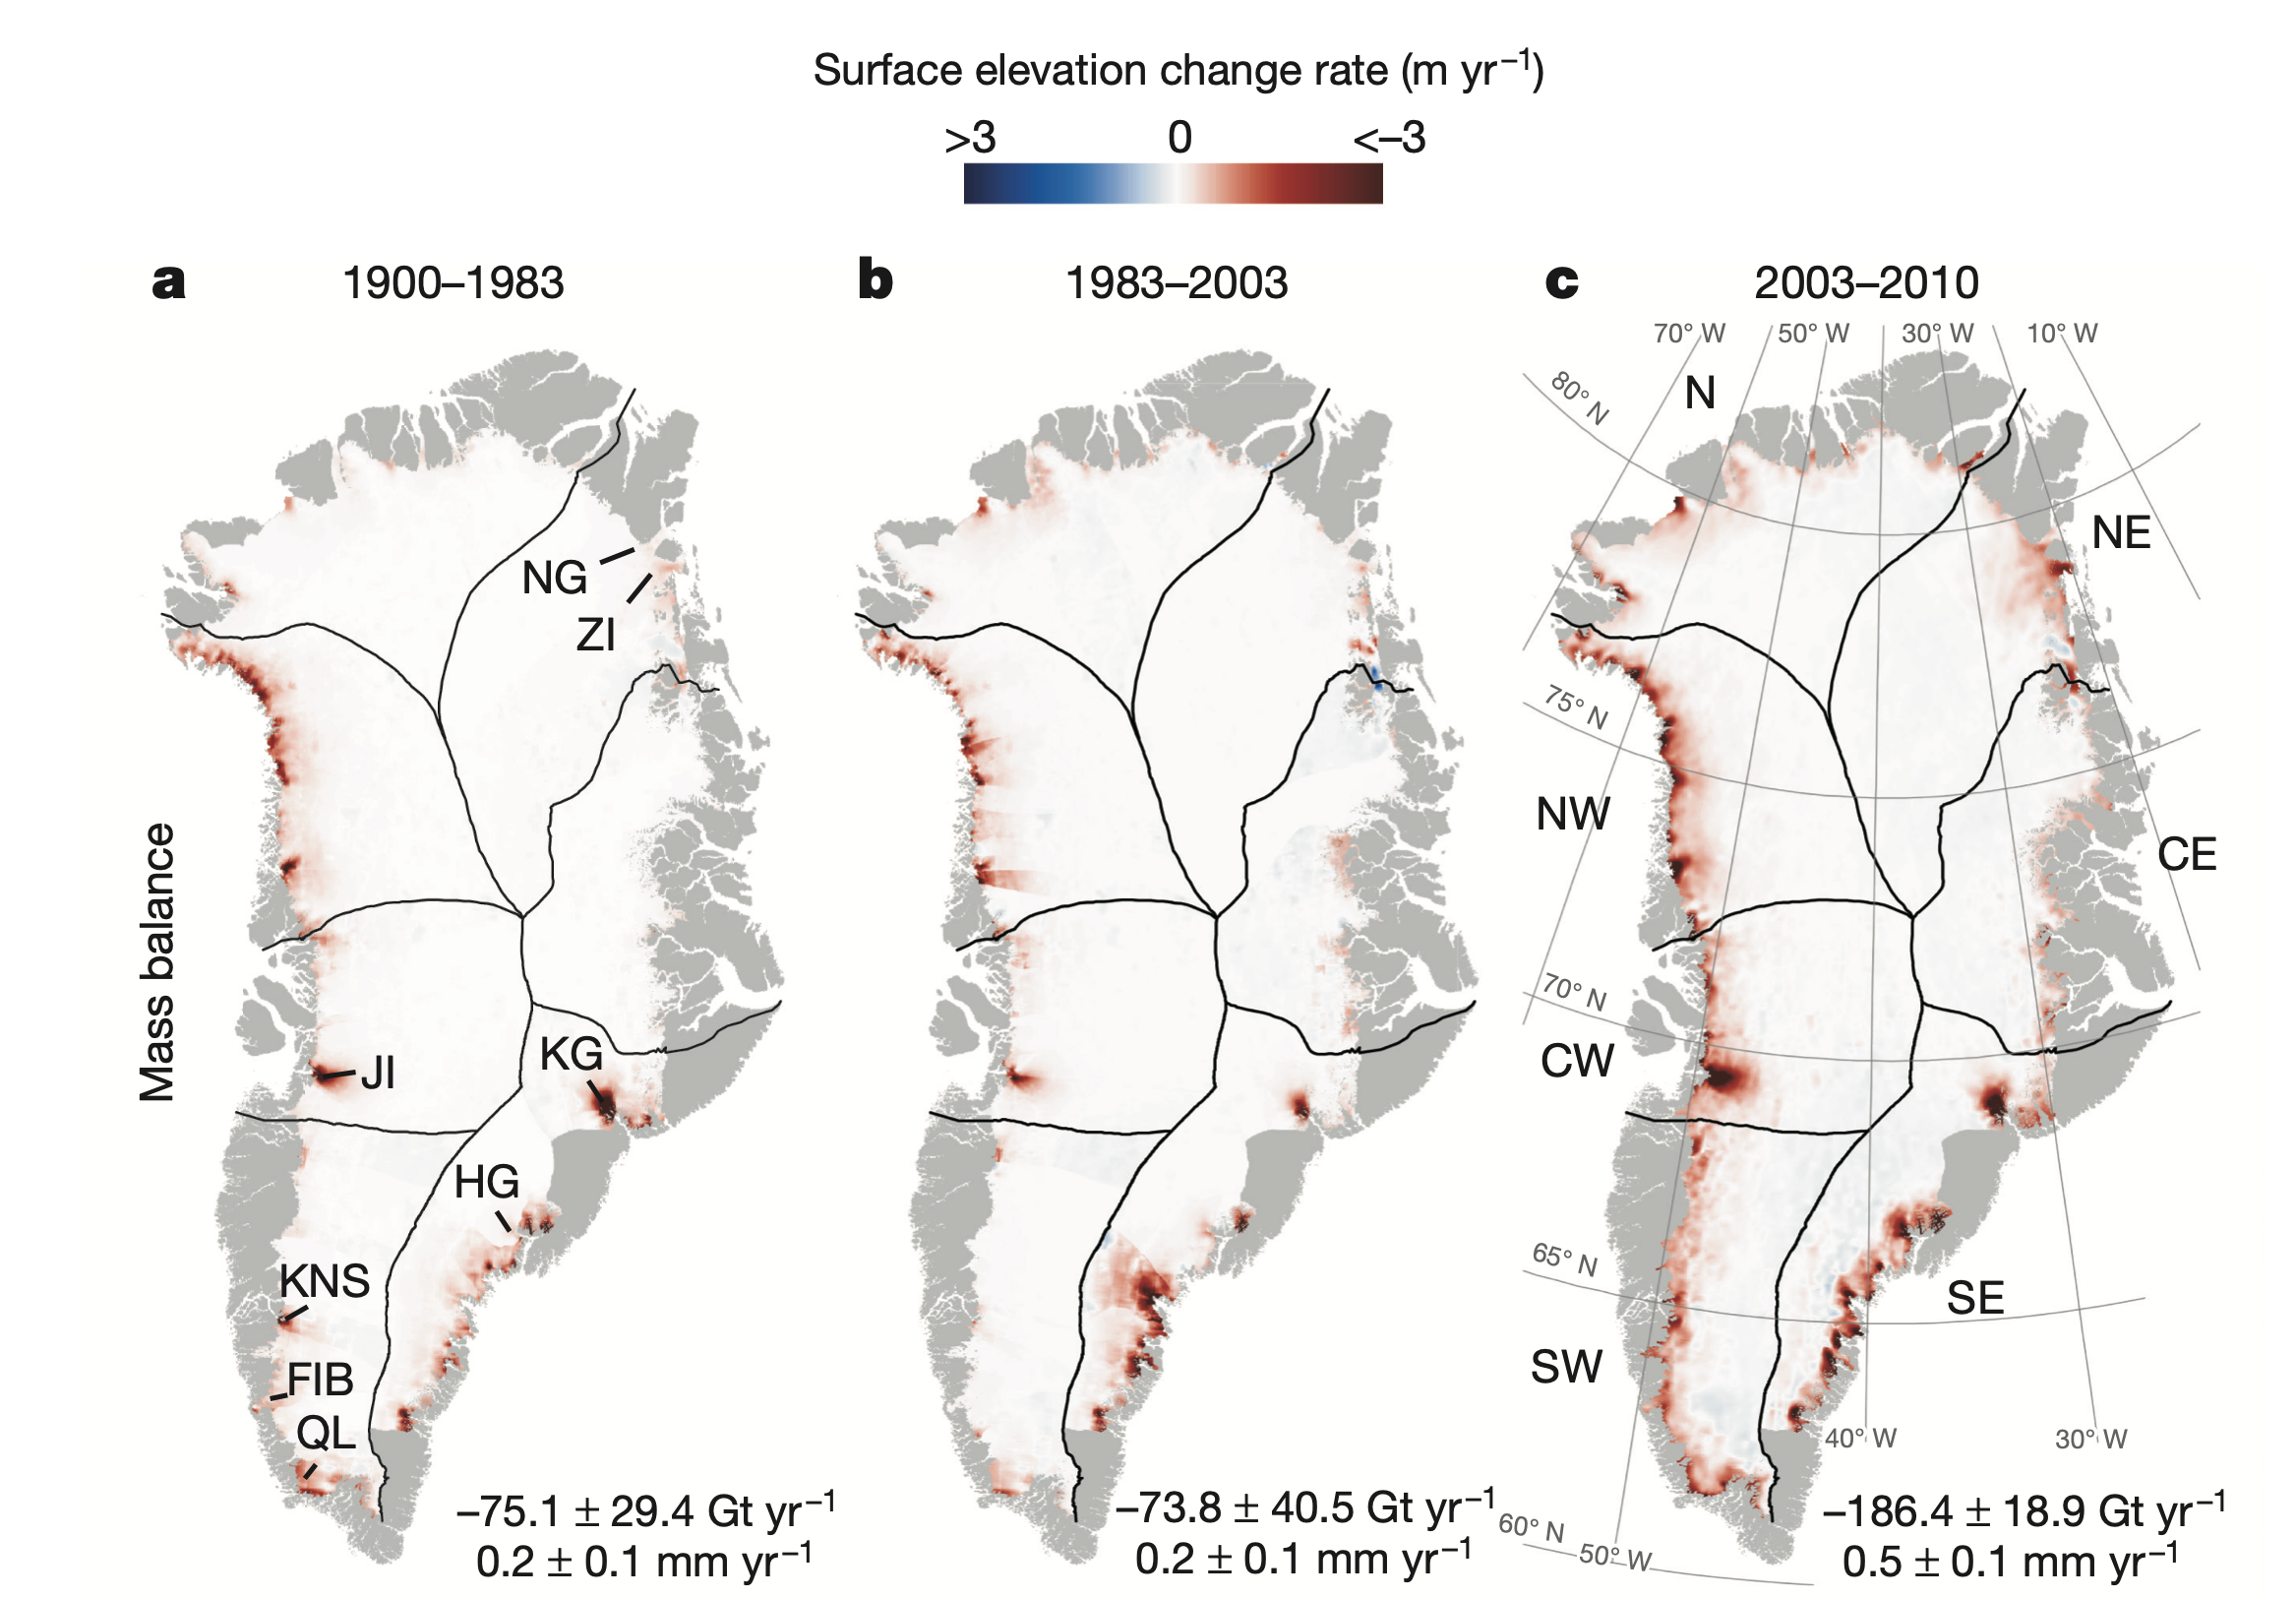
Figure 3 — Surface elevation change rates in Greenland during 1900–1983 (a), 1983–2003 (b), and 2003–2010 ©. The numbers listed below each panel are the integrated Greenland-wide mass balance estimates expressed as gigatonnes per year and as millimetre per year GMSL (global mean sea level) equivalents. From Kjeldsen et al. 2015[1].
If we look in more detail at changes over 1972–2018, we can further see that the ice sheet was mostly in balance (gain about the same amount of snow/ice in winter as is lost in summer) during the 1970s and 1980s[12]. It was only in the mid-1990s that Greenland ice loss began to increase more substantially.
Over the last 20 years, ice loss has been rapid and large, creating measurable sea level rise, which we experience as increases in coastal erosion, flooding, problems with water and sewer systems at the coasts, and saltwater inundation of freshwater sources.
Response: The “fact check” does not refute the statement quoted, which is about the rate of sea level rise 80 years ago. Quoting the rate over the seven-year period 2003–2010 is not climatologically relevant. And comparison of the rate over the twenty years from 1983 with the average over the 83 years from 1900 obscures the decadal variability during that longer period.
The comparison of recent decadal-scale changes with centennial scale averages is a common artifice to obscure prior decadal-scale variability, whose presence makes recent decades seem less unusual.
The 2019 paper by Frederikse et al. clearly shows that Greenland’s contribution to sea level rise around 1940 was about three times higher than it was in the last decades of the 20th century.
__________________________________________________________
”The rate of sea-level rise has not accelerated.”
Zeke Hausfather, Director of Climate and Energy, The Breakthrough Institute:
This statement is inaccurate; all observational sea level rise (SLR) datasets show rapid acceleration in recent years, and most now show sea levels rising faster than at any point since records began in the early 1900s.Reconstructing past changes in global sea levels is far from a simple task. While high-quality satellite measurements with global coverage have been available since the early 1990s, prior to that researchers had to rely on tide gauges scattered around the world.
These tide gauges primarily cover coastal regions, leaving it up to researchers to figure out how best to fill the gaps. Tide gauges are also subject to factors that can complicate the interpretation of local sea level changes, namely subsidence (sinking land) or isostatic rebound (rising land due to melting glaciers). The IPCC 5th Assessment Report featured three estimates of global sea level rise[6]: from Church and White[13], Jevrejeva[14], and Ray and Douglas[15]. Two additional SLR datasets — Hay et al.[16] and Dangendorf et al.[17] — have been published in recent years.
All five of these datasets are shown in the figure 5 below (coloured lines), along with satellite altimeter measurements (in black) after 1993.

Figure 4 — Estimates of global mean sea level from 1992–2006 (in millimetres), and 20-year average rate of global sea level rise (mm/year) from various references. From Carbon Brief.
Recently, there has been some debate around whether the current rate of SLR exceeds that experienced back in the 1940s. Three of the five datasets (Dangendorf, Hay, and Church and White) suggest that the current rate of sea level rise — as measured by accurate satellite altimeters — is around 50% faster than was experienced in the 1940s. The Ray and Douglas dataset suggests that current rates of SLR measured by satellite altimeters are modestly above the 1940s peak, while one of the five — Jevrejeva — suggests that the current rate of SLR is below that of the 1940s. However, even the authors of the Jevrejeva dataset suggest in their accompanying paper that a longer view of sea level — from 1800 to present — still suggests that “the rate of sea level rise is increasing with time”[14].
There is also evidence of accelerating SLR over the post-1993 period when high-quality satellite altimetry data is available. According to the 2018 State of the Climate report[18], acceleration in SLR during the post-1993 period is around 0.1mm each year; this means that the rate of SLR is increasing by 1mm per year each decade.
For more details, see my discussion of sea level rise acceleration at Carbon Brief.
Thomas Frederikse, Postdoctoral researcher, Jet Propulsion Laboratory/California Institute of Technology:
Satellite measurements, which started in 1993, show a clear acceleration in sea level [19]. Also, if we go further back in time, tide-gauge observations show that sea levels are persistently accelerating since the 1960s[4], and overall, the observed sea-level rise during the 20th century is higher than during any other century over the last 3000 years[20,21].Daniel Swain, Climate Scientist, University of California, Los Angeles:
[Comment from a previous evaluation of a similar claim]
This is literally the opposite of what a growing body of recent evidence has shown. Research actually shows that rates of global sea level rise have accelerated in recent years[19], and estimates regarding the upper end of plausible further sea level rise over the coming century have actually increased considerably as the non-linear contribution by continental ice sheets comes into clearer focus[22]. So, if anything, sea level rise is becoming more of a problem than previously thought.
Response: The statement is a misleading compression, likely due to Mr. Mills’ (or his editor’s) need for brevity. A more complete description would be the acceleration seen over the past few decades is comparable to that seen around 1930, when human influences on the climate were much smaller.
But it is incorrect to attribute the brief statement to me. Chapter 8 of Unsettled is a discussion of sea level data like that shown in the graph, including the acceleration (and deceleration) earlier in the 20th century that complicates attribution of the acceleration in recent decades.
__________________________________________________________
”The extent of global fires has been trending significantly downward.”
Zeke Hausfather, Director of Climate and Energy, The Breakthrough Institute:
This statement is accurate but misleading. The vast majority of fires globally are purposefully set for agricultural clearing, and these have declined in recent years. Conflating all fires with forest and wildfires is not helpful in understanding changing drivers of fire risk.A 2014 study suggests that in the tropics climate change may have also reduced the area burned over the past 50 years, due, in part, to wetter conditions[23]. However, they find that climate change has likely increased fire risk in the high latitudes and mid-latitudes over recent decades.

Figure 5 — Contribution of different factors in changes since 1900 in forest-fire area globally (a) and for different regions : (b) northern high latitudes (>55°N), © northern extratropics (55°N to 30°N), (d) tropics (30°N to 20°S), and (e) southern extratropics (>20°S). Effects of climate change (including changes in temperatures and precipitation) are shown by the vertical stripes. Human land management activity is shown by the diagonal stripes, while the effect of CO2 fertilization and nitrogen deposition is shown by the dots. From Yang et al. (2014)[23].
Hotter and drier conditions have been a major factor in the increase in areas burned by wildfires in many regions — such as the western US — in recent years. For example Williams et al. (2019) found that in California, “nearly all of the increase in summer forest‐fire area during 1972–2018 was driven by increased VPD [vapor pressure deficit]” driven by climate change[24]. Earlier work by Abatzoglou and Williams (2016) found that fuel aridity — driven by observed warming and drying — was the major driver of enhanced fire activity in the Western US[25].
For more details, see my Carbon Brief analysis of the role of climate change in US wildfires.
Daniel Swain, Climate Scientist, University of California, Los Angeles:
[Comment from a previous evaluation of a similar claim]
Overall trends in area burned globally are strongly driven by decreases in intentional agricultural burning in tropical areas, which is not related to climate change. In regions where non-agricultural fires occur naturally (including the western United States[24–26], eastern Australia[27], and the Siberian Arctic[28], there is strong evidence that climate change has already increased the severity and extent of wildfire[29].Stefan Doerr, Professor, Swansea University:
[Comment from a previous evaluation of a similar claim]
The observed decline in global average area burned has been misused numerous times to support false claims about the role of climate change in wildfire trends. Climate change as well as human activities affect global fire activity (see here for a summary and update on Doerr and Santin, 2016[8]).
The overall global decrease is mostly driven by less fire in what used to be more extensive savannahs and grasslands and is largely due to the human driven removal of flammable vegetation. In quantitative terms, fire in those grassy ecosystems account for around 70% of the total global area burnt, so the reduction in fire activity here outweighs the increase in burned area that we are seeing in other parts of the world over the last two decades where fires have greater impacts such as Canada, parts of the USA or Siberia.
In other words, where humans have not converted flammable landscapes to less or-non flammable landscapes by removing or changing the vegetation, warming temperatures are, overall, associated with an increase in fire activity. A very thorough global analysis of trends and fire knowledge overall has been made by Bowman et al. in 2020[9].Gary Yohe, Professor of Economics and Environmental Studies, Wesleyan University:
Fires are local events whose regional patterns of intensity and frequency fit well into risk-based calibrations. They can also be perfect examples of a new troubling tendency in which several types of impacts attributed to climate change show up at the same place at the same time, feeding on each other combining forces to produce still greater extremes — something that long-term trends of one type of climate change impact simply cannot explain.
Take, for example, the 2020 California fire experience. Only three of the state’s largest 20 fires (in terms of acres burned) had burned prior to 2000, but nine of the biggest 10 have occurred since 2012. That is, moving toward the next decade, extreme fires were becoming more likely and more intense. In 2017, 9,270 fires burned a record 1.5 million acres.The Mendocino Complex fire the next year became the “largest wildfire in California history.” And then came 2020. A new largest fire in California history, the Complex fire, started in August of 2020. Soon after came the 3rd, 4th, 5th, and 6th largest in history. By October 3, these five conflagrations had combined with nearly 8,000 other more “ordinary” fires to kill 31 people and burn more than four-million acres; and, on that day, all five were still burning at the same time.
Why is this happening? It is becoming clear that nature can produce combinations of influences on local environmental conditions. Many of the 2020 fires in California were caused by literally thousands of dry lightning strikes that fed into a witches’ brew of simultaneous conditions that have all been linked to global warming:
· the end of a multi-year record drought
· all-time record heat punctuated July, August, and much of September
· widespread tinderbox stands of dead trees from multi-year and growing infestations of bark beetles
· decades of normal warming that had extended the western fire season by some 75 days
Response: The fact checkers do not dispute the statement, which surprises most non-experts, who typically believe that human influences on the climate are the dominant cause of fires. However, I agree that it requires more context than is possible to give in a 900-word book review. I give that context, including many of the points raised, in Unsettled’s Chapter 7.
__________________________________________________________
”tornado frequency and severity are also not trending up; nor are the number and severity of droughts.”
Kerry Emanuel, Professor of Atmospheric Science, MIT:
Koonin sets up a strawman in claiming that tornado frequency and severity are not trending up. The scientific consensus on this is that we simply do not have the data to determine trends in tornadoes, and what little theoretical work has been done on this suggests that severity might go up and frequency might go down, but again there is no real consensus.Daniel Swain, Climate Scientist, University of California, Los Angeles:
[Comment from a previous evaluation of a similar claim]
There is relatively little evidence in either direction at this point in time regarding global or even regional trends in tornado frequency/intensity. This is largely due to sparse and temporally inhomogeneous historical records in the United States, and virtually non-existent records in other regions. There is some evidence of regional shifts in tornado frequency[30], and perhaps an increase in overall tornado “power” in the United States[31], but in general there is an absence of strong evidence regarding this claim.
Future projections regarding climate change and tornado risk are of somewhat low confidence, but there is evidence that atmospheric environments favorable for severe convective storms (which are the types of storms capable of producing tornadoes) may increase in the future due to climate warming[32,33].Andreas Prein, Project Scientist, National Center for Atmospheric Research:
[Comment from a previous evaluation of a similar claim]
It is not clear if climate change will make U.S. tornadoes worse or more frequent. The observational record does not show any significant change in the frequency of U.S. tornadoes in the last 60 years but there is a tendency that more tornadoes occur during big outbreak days[34] and there are spatial shifts in the occurrence of tornadoes[30]. Whether these changes are related to climate change is, however, unclear.
Response: The statement is true, and the fact checkers do not dispute it, but rather give reasons why it is true and why it might not be true in the future. The second half of Unsettled’s Chapter 6 covers the points they raise, including the clustering and spatial shifts mentioned by Swain and Prein.
Highlighting that there are no climatologically significant trends in tornadoes, as is true for many other severe weather phenomena, is a tonic to the widespread perception that “we’ve already broken the climate”. Emanuel’s claim of a strawman is then curious. Would he have scientists discuss only those severe weather phenomena that do show a deleterious trend? Doing that would alarmingly misinform non-experts.
__________________________________________________________
” the number and severity of droughts are also not trending up.”
Daniel Swain, Climate Scientist, University of California, Los Angeles:
[Comment from a previous evaluation of a similar claim]
Observed spatial trends in global hydroclimate over the past century have been consistent with those expected from human influence in the climate system[35]. In many mid-latitude and subtropical regions, this has indeed included an increase in the frequency/intensity of drought[36,37]–but in other regions (such as the Northern Hemisphere high latitudes), this includes an increase in moisture availability and decrease in drought (as expected from climate model simulations). Therefore, it doesn’t really make sense to make blanket statements regarding overall global drought trends, since only some places are expected to get drier (and others wetter) in a warming climate.
Response: Perhaps, as Swain says, “it doesn’t really make sense to make blanket statements” like this, but that’s precisely what the IPCC did. Unsettled (pg 98) quotes the following from IPCC AR5 WGI Section 2.6.2.3
. . . low confidence in a global-scale observed trend in drought or dryness (lack of rainfall) since the middle of the 20th century . . .
And the report’s page 215 elaborates:
In summary, the current assessment concludes that there is not enough evidence at present to suggest more than low confidence in a global-scale observed trend in drought or dryness (lack of rainfall) since the middle of the 20th century, owing to lack of direct observations, geographical inconsistencies in the trends, and dependencies of inferred trends on the index choice. Based on updated studies, AR4 conclusions regarding global increasing trends in drought since the 1970s were probably overstated. However, it is likely that the frequency and intensity of drought has increased in the Mediterranean and West Africa and decreased in central North America and north-west Australia since 1950.
As my book’s Chapter 7 says (beginning on page 138), it is also difficult to see any long-term trend in drought across the contiguous US, but there are clear regional trends, particularly in the US Southwest.
__________________________________________________________
“Humans have had no detectable impact on hurricanes over the past century”
Kerry Emanuel, Professor of Atmospheric Science, MIT:
This statement is flat out wrong. In the first place, the theoretically predicted trends would not have been detectable in the sparse and noisy hurricane record until recently, and in fact they HAVE recently been detected. The most up-to-date research published in the Proceedings of the National Academy of Sciences demonstrates an increase in the proportion of hurricanes that become major hurricanes (Category 3–5) globally, supporting theoretical predictions that date back to 1987 (see figure below)[38].

Figure 6 — The proportion of major hurricane intensities to all hurricane intensities globally from 1979–2017. Data is binned into 3-year periods. The proportion of global major hurricanes increased by 25% over the 39-year time period analyzed. From Kossin et al. (2020)[38].
Furthermore, the phrase “in the past century” is telling nothing since no one familiar with the global record of tropical cyclones would look at data prior to 1980; it is just way too poor to be able to detect trends.
Response: Emanuel seems to have forgotten that he was a co-author on a 2019 paper that displayed and assessed hurricane trends extending back more than a century. I paraphrase that paper’s conclusion on Unsettled’s page 119:
Those authors found that the strongest case for any detectable change in tropical cyclone activity was a very slow northward shift of the average track of storms in the northwest Pacific (0.19° ± 0.125° latitude per decade over the past seventy years, a 1.5 σ result). Moreover, even for that slow, small change (21 km or 13 miles per decade), eight of the eleven authors had only low to medium confidence. Most significantly, the majority of the authors had only low confidence that any other observed tropical cyclone changes were beyond what could be attributed to natural variability.
As I discuss in Unsettled’s Chapter 6, that conclusion is consonant with those of 2014 US National Climate Assessment and of the subsequent 2017 CSSR (its Section 9.2).
The 2020 Kossin et al. paper that Emanuel cites with great certainty to support the detection of human influences explicitly says it does not claim such, as I cover on Unsettled’s page 120:
In that study [Kossin et al;, 2020], the researchers used a new method to analyze satellite imagery of tropical cyclones to determine storm intensity. They found a short-term trend toward more intense storms in the North Atlantic basin and linked it to a multidecadal variability that “complicates detection because the climate drivers of that variability are not fully understood.” Their bottom-line conclusion reads:
Ultimately, there are many factors that contribute to the characteristics and observed changes in TC intensity, and this work makes no attempt to formally disentangle all of these factors. In particular, the significant trends identified in this empirical study do not constitute a traditional formal detection, and cannot precisely quantify the contribution from anthropogenic factors.
The fact that human influences on hurricanes have not been detected contradicts common perception among non-experts. The secondary point of why that is so (poor historical data or a signal to noise problem or something else) is important for a scientist, but too detailed to cover in a book review. It is, however, well-covered in Unsettled’s Chapter 6.
Emanuel also takes issue with “in the past century”. But century-long data are assessed in Emanuel’s 2019 paper mentioned above, papers such as Villarini and Vecchi in 2012 discuss centennial-scale reconstructions, and the CSSR mentions low confidence in “centennial trends” in its section 9.2. So Emanuel is faulting common usage in his field. C’mon, man!
In any event, I discuss the low quality of older hurricane data on Unsettled’s page 113.
Daniel Swain, Climate Scientist, University of California, Los Angeles:
[Comment from a previous evaluation of a similar claim]
While there remains no strong evidence for an increase in tropical cyclone (hurricane) frequency on a global basis, there is evidence that the most intense tropical cyclones are indeed becoming stronger in terms of maximum wind speeds and minimum central pressure[38] and are producing more extreme rainfall[39].
In fact, these trends are consistent with predictions regarding tropical cyclone behavior due to global warming: there is a strong expectation that the maximum potential intensity of hurricanes will increase due to rising ocean temperatures, even as the overall frequency of such storms does not change greatly or perhaps even decreases[40].
Response: This is not a criticism but rather supplementary information to the primary point. And I agree, as I write on Unsettled’s page 120:
The fact is that, while it is not unreasonable to think that warming might indeed lead to some kind of change in hurricane activity at some point, right now there simply isn’t evidence that this is happening.
__________________________________________________________
”Global crop yields are rising, not falling.”
Frances Moore, Assistant Professor, University of California Davis:
While global crop yields are rising, this does not constitute evidence that climate change is not adversely affecting agriculture. IPCC estimates are that increased heat and drought resulting from anthropogenic warming will slow the rate of yield growth, not reverse it[6]. Given a growing population and rising incomes, this will place increasing strain on the global food supply. A recent paper by Ortiz-Bobea et al. (2021) found that anthropogenic warming since 1961 removed the equivalent of 7 years of productivity growth[7]. The effect is substantially more severe in warmer regions such as Africa and Latin America and the Caribbean. Moreover, the authors concluded that “Global agriculture has grown more vulnerable to ongoing climate change”.David Lobell, Associate Professor, Stanford University:
This statement implies that people are claiming global crop yields are falling, which is false. it also is a logical fallacy to say that if things aren’t causing a net decrease then it isn’t a concern. One could say the economy is larger than it was 30 years ago, so nothing hurting the economy is a concern. Or global health is better, so a pandemic is no big deal.
Response: The fact checkers agree with the statement, which is another tonic to the notion that the world is suffering from climate devastation. Their additional points concern proving counterfactuals about a different measure of agricultural productivity — what would agriculture have been if the climate had not been subject to human influences? There are fundamental problems in validating such claims, as I discuss in Unsettled’s Chapter 9.
__________________________________________________________
”The net economic impact of human-induced climate change will be minimal through at least the end of this century.”
Gary Yohe, Professor of Economics and Environmental Studies, Wesleyan University:
It is impossible to support a statement like this because economic damages are very dependent on unpredictable investments in adaptation and because sectoral coverage of the aggregate economy is woefully incomplete. A much more honest statement should read something like this from the IPCC Fifth Assessment: “there is low to medium confidence in attribution of climate change influence on a few sectors… Risks of global aggregate impacts are moderate for additional warming between 1°C to 2°C compared to 1986–2005… Aggregate economic damages accelerate with increasing temperature (limited evidence, high agreement) but few quantitative estimates have been completed for additional warming around 3°C.”
Since 2014, more comprehensive studies have offered still incomplete portraits of the correlations between distributions of net economic damage (not just fitted values) along alternative global development pathways and increases in global mean temperature[41]. See figure below :

Figure 7 — Estimates of total direct damages across all sectors from climate change on the U.S. economy. The x-axis refers to temperature change (°C) for 2080–2099 relative to 1980–2010. From Hsiang et al. 2017[41].
Response: I agree that there are substantial uncertainties in the projection of economic impacts. But Yohe seems to have missed the first Key Point in the executive summary of Chapter 10 of the AR5 Working Group II report that he cites:
For most economic sectors, the impact of climate change will be small relative to the impacts of other drivers (medium evidence, high agreement). Changes in population, age, income, technology, relative prices, lifestyle, regulation, governance, and many other aspects of socioeconomic development will have an impact on the supply and demand of economic goods and services that is large relative to the impact of climate change.
That report then goes on to summarize a variety of estimates of net impact, which on average show a few percent decrement of the global economy for a warming of a few degrees by the end of this century.
The graph Yohe presents from the 2018 National Climate Assessment shows something similar for the US economy. [It’s worth noting that the graph’s temperatures are referred to the end of the 20th century, which is already about 1C warmer than “pre-industrial”. So, for example, the impacts shown for 5C correspond to a warming four times (!) the widely discussed 1.5C “guardrail”.]
As I discussed in a 2018 WSJ OpEd, and further elaborate in Unsettled’s Chapter 9, these are minimal impacts on an economy growing at plausibly projected rates, equivalent to a few years’ delay in growth 70 years from now. For example, if today’s US economy of about $20T were to grow at 2% per annum for 70 years, it would be $80T in 2090. Per Yohe’s Figure 7 above, a warming of 5C would cause about a 4% climate impact, so that the GDP in 2090 would be $76.8T rather than $80T. That difference is well within the uncertainty in any projection of the economy, which, as noted above, is predominantly determined by non-climatic factors. And if it were to occur, it would be made up by 2 years of growth.
__________________________________________________________
”while global atmospheric CO2 levels are obviously higher now than two centuries ago, they’re not at any record planetary high — they’re at a low that has only been seen once before in the past 500 million years.”
Scott Wing, Curator and Research Scientist, Department of Paleobiology, Smithsonian Institution:
This statement is incorrect. CO2 levels were lower than today’s at every glacial maximum for the last 800,000 years[42], as revealed by ice core records (see Figure 8 below).

Figure 8 — Past CO2 concentration obtained from air trapped in ice cores from Antarctica. From https://keelingcurve.ucsd.edu
For times before ice cores (>800,000 years) CO2 levels have to be inferred less directly from geochemical or biological proxies. These proxies have larger uncertainties associated with them than direct measurements or ice cores. Still, today’s levels are thought to be similar to those for the Pliocene and late Miocene, 2–10 million years ago. Of course polar ice caps were much smaller and sea levels much higher when CO2 was as high as it is now.
Going farther back atmospheric CO2 concentrations becomes less certain, but probably it was higher than present during much of the long warm period prior to Antarctic glaciation beginning 34 million years ago and going back to the last major ice age in the Carboniferous, about 300 million years ago[43].
Lee Kump, Professor, PennState University:
This statement is misleading. Yes, atmospheric CO2 levels have been much higher than they are now in the VERY DISTANT geological past. But 500 million years ago the sun was dimmer than today, and high CO2 levels compensated for low irradiance. As the sun has become brighter over the history of our planet, CO2 levels in general have fallen, keeping our planet habitable[44]. So statements like “record planetary high” are meaningless. What’s meaningful is that at over 400 parts per million, the atmosphere today has a carbon dioxide level that Earth hasn’t seen in the last 2–5 million years, and climates at that time were warmer than today, ice sheets were smaller, and sea level was higher. Various scenarios for fossil-fuel burning take us above 1000 ppm in the next several decades, a level not seen for over 50 million years and at a time without ANY significant ice sheets on the planet and a much warmer climate (at least 10°F warmer on a global average).

Figure 9 — Estimates for atmospheric CO2 concentration (colored lines) during the last 420 millions years, based on different proxies. Average error shown as light grey bands. From Mills et al.[44]
Dana Royer, Professor, Wesleyan University:
The fact that CO2 levels have been higher in the past[45] should not be used as evidence that humans are not changing the climate or that we should not be concerned about our near future. Statements like the one above are common for climate skeptics, but they widely miss the mark for two main reasons:If we continue on our current trajectory, global temperatures will soon reach levels not experienced since the time when ice sheets (like on Antarctica and Greenland) were absent. This was a “very” different Earth, and one humans have no experience living in.
The “rate” of climate change is faster than all documented climate change events in the geologic record. The fastest rates of change that we know about (in thousands of years) are associated with mass extinctions. Our current rate of change is hundreds of years. This is scary and does not bode well.
Response: The correctness of Mr. Mills’ necessarily brief statement depends upon the temporal resolution. As Figure 8 shows, is doesn’t hold for the recent past at high resolution, but is correct for older times at coarser resolution. I cover many of the points that the three checkers raise in Unsettled’s Chapter 3.
However, Kump’s allusion to CO2 concentrations exceeding 1000 ppm in the next several decades is absurd. CO2 concentrations are currently some 420 ppm and have been increasing recently by about 2.3 ppm per year. At that rate, it would take several centuries, not decades, to reach 1000 ppm. And there is no indication that such a dramatic acceleration of fossil fuel use is in the offing.
]]>