Strong glacial-interglacial variability in upper ocean hydrodynamics, biogeochemistry, and productivity in the southern Indian Ocean
Abstract
In the southern Indian Ocean, the position of the subtropical front – the boundary between colder, fresher waters to the south and warmer, saltier waters to the north – has a strong influence on the upper ocean hydrodynamics and biogeochemistry. Here we analyse a sedimentary record from the Agulhas Plateau, located close to the modern position of the subtropical front and use alkenones and coccolith assemblages to reconstruct oceanographic conditions over the past 300,000 years. We identify a strong glacial-interglacial variability in sea surface temperature and productivity associated with subtropical front migration over the Agulhas Plateau, as well as shorter-term high frequency variability aligned with variations in high latitude insolation. Alkenone and coccolith abundances, in combination with diatom and organic carbon records indicate high glacial export productivity. We conclude that the biological pump was more efficient and strengthened during glacial periods, which could partly account for the reported reduction in atmospheric carbon dioxide concentrations.
Introduction
The Southern Ocean plays a fundamental role in global climate. It interconnects the Atlantic, Pacific and Indian Ocean basins, and is therefore important for transmitting climate signals from one region to another1. Among the characteristic features of the Southern Ocean sector of the Indian Ocean are the distinct ocean fronts and associated water masses (Fig. 1a)2, the dynamics of which have been suggested to impact global climate variability over multiple timescales2,3. These frontal boundaries are considered key players in marine ecosystem of subpolar areas, where the uptake of large quantities of atmospheric carbon dioxide (pCO2) takes place, and therefore impacts both the biological and carbonate pumps4. In the Southern Ocean, where CO2 exchange between the ocean and atmosphere is especially high, deep waters enriched in respired CO2 and nutrients are brought to the surface by vertical mixing (e.g. wind-driven upwelling)5,6, promoting high rates of phytoplankton productivity in the photic layer7. However, it is thought that the efficiency of CO2 outgassing from the ocean to the atmosphere through the biological pump is controlled by ambient physico-chemical properties of the water column8 and the abundances of different phytoplankton groups in the upper ocean5,9. Thus, these areas are crucial locations for determining the link between upper ocean biogeochemistry and the climatic factors that drive changes in phytoplankton abundance and production, and its consequent effect on the biological and carbonate pumps.
Coccolithophores—unicellular haptophyte algae—are unique among other marine phytoplankton groups because of their ability to utilise carbon for both photosynthesis (biological pump) and calcification (coccolith production, carbonate pump), and hence are critical components of the global carbon cycling10. These organisms are the dominant calcifying phytoplankton of the modern oceans, contributing up to ~10% of the global phytoplankton biomass11, and have been estimated to produce up to ~80% of marine pelagic carbonate12. Coccolithophores are considered the only calcifying phytoplankton in the Southern Ocean13, with distribution that is primarily controlled by latitudinal ocean temperature zonation and frontal system dynamics14. Because of their sensitivity to variations in nutrient availability and light intensity, as well as to temperature and salinity, coccolithophores are valuable indicators of past oceanographic conditions. Moreover, coccolithophores provide independent proxies for paleoceanographic reconstructions from both organic (alkenones) and inorganic (coccoliths) fossil records15. C37:3-2 alkenones are organic biomolecules synthesised by certain groups of coccolithophores (e.g. Emiliania huxleyi and Gephyrocapsa oceanica), the abundance of which are important proxies for estimating past sea surface temperature (SST, UK′37
) and export productivity16,17. In the southern Indian Ocean, an increase in C37:3-2 alkenone abundances during the late Pleistocene has been linked to an increase in export productivity as a consequence of the northward subtropical front (STF) migration during glacial periods18.
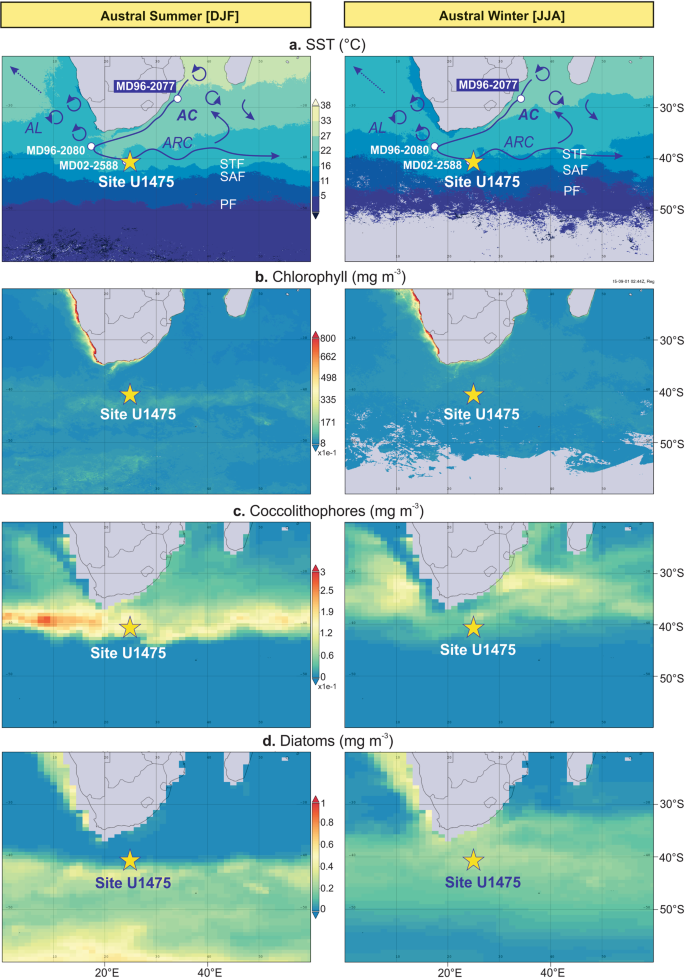
The STF, currently positioned between 39 and 41°S, is considered a major biogeochemical divide separating the colder and fresher nutrient-rich waters of the Southern Ocean from the warmer and saltier waters of the Agulhas Current (AC) that return to the subtropical Indian Ocean as the Agulhas return current (ARC)19. The ARC represents the strong current along the STF (also called the subtropical convergence) located south of the African continent20. It was previously thought that the ARC is closely associated with the Southern Ocean STF, however a more recent study reveals that the STF water mass boundary in the Indian Ocean constitutes a zonally unique and independent frontal characteristics21. The authors recognised the existence of a single dynamical STF (DSTF), delineating the southern water mass boundary of the subtropical gyre circulation in the southern Indian Ocean. The DSTF is characterised by strong SST and sea surface gradients with no significant seasonal cycle21.
During recent glacial stages of the late Pleistocene, palaeoceanographic evidence from various proxies suggested that the STF migrated north of its modern position in the Southern Ocean sector of the Indian Ocean18,22,23, and has been proposed to impact upper ocean hydrodynamics and drive local nutrient availability and regional export production2. The equatorward movement of the STF during glacial periods has been confirmed by SST reconstructions using Mg/Ca in planktic foraminifera from the western flank of the Agulhas Bank (MD96-2080)24, and UK′37
paleothermometry based on the unsaturation ratio of C37:3-2 alkenones in sediment cores from the Natal Valley (MD96-2077)18 and the southern Agulhas Plateau (MD02-2588)25. During extreme glacial marine isotope stages (MIS) 12 and 10, the Natal Valley record suggests a ~6 °C SST cooling accompanied by maximum peaks in export productivity, and a potential northward STF shift of up to 7° latitude18. Fluctuations in upper ocean productivity at this locality indicate a direct response of both calcareous and siliceous phytoplankton groups to the STF migration18,25,26. A similar observation has been noted at the Agulhas Plateau, where maximum alkenone concentrations and diatom productivity coincided during glacial stages 10, 8 and 625. Additional evidence of elevated upper ocean productivity in response to the northward STF migration has been recorded in benthic foraminifera record in another core from the southern Agulhas Plateau (MD02-2589), which the authors linked to the overall flux and variability of organic carbon supply to the seafloor27. The increased delivery of organic matter has been interpreted to be related to the expansion of the Subantarctic Zone (SAZ), with the northward STF migration and its convergence with the Subantarctic Front (SAF)27. This is in accordance with a study showing highest chlorophyll-α concentrations at the modern positions of the STF and SAF4. The regional hydrodynamic setting during intervals of an expanded SAZ may have resulted in a more intense local upwelling and subsequent vertical advection of nutrients to the surface.
Despite the numerous studies on the southern Indian Ocean linking STF migration to variations in primary productivity, understanding remains limited regarding how biotic communities have responded to changes in water column biogeochemistry (nutrients, productivity) and hydrodynamic characteristics (SST, stratification) with varying STF position over glacial-interglacial cycles. Here we focus on coccolithophore communities in the southern Indian Ocean and utilise both their organic and inorganic remains to track STF migration and its consequent effect on biogeochemistry and hydrodynamics, and ultimately determine the climatic impacts of these changes at the Agulhas Plateau over the last 300 kyr. We present new high-resolution organic biomarker (C37:3-2 alkenones) and full coccolith assemblage records from the International Ocean Discovery Programme (IODP) Site U1475 at the Agulhas Plateau.
Modern oceanographic setting
Site U1475 (41°25.61′S; 25°15.64′E, 2669 m water depth) was drilled on the southwestern flank of the Agulhas Plateau in the Southern Ocean sector of the Indian Ocean (Fig. 1)28. Upper ocean hydrographic conditions over the Agulhas Plateau are primarily governed by the interplay between the ARC, representing the retroflected warm and salty subtropical Indian Ocean surface waters transported by the AC, and the cold and fresh Subantarctic surface waters (SASW) occurring toward the south of the STF19. Seasonal SSTs vary from 11 to 17 °C (Fig. 1a) and sea surface salinities range between 35.1 and 35.429. A zonal band of elevated surface chlorophyll-α concentrations (0.5–0.8 mg m−3) during austral summer has been detected by satellite remote sensing, reaching peak concentrations (1.25 mg m−3) in the SAZ, at the maximum confluence between the STF and SAF (Fig. 1b)25. Coccolithophores and diatoms account for the high chlorophyll-α concentrations within the SAZ, forming the boundary between the northern coccolithophore and southern diatom occurrences as observed in the satellite-derived imagery by the National Aeronautics and Space Administration (NASA) (Fig. 1c, d)30. The satellite images show high coccolithophore concentrations between STF and SAF during austral summer, whereas increased numbers are recorded up to ~10° latitude further north during austral winter. By contrast, diatoms concentrate at the SAZ during austral summer, while abundances decrease and the communities are dispersed further north, up to ~30°S during austral winter. The satellite observations can be confirmed in modern coccolithophore assemblages, with increased abundances and diversity at the subtropical region and highest abundances largely dominated by E. huxleyi at the SAZ during austral summer31. On the other hand, surface sediments associated with the AC showed higher diversity and dominance of coccolithophore species E. huxleyi, G. oceanica, Calcidiscus leptoporus and Umbilicosphaera sibogae26. Presently, nutrients in the region are sourced from the northward advection and lateral mixing of nutrient-rich SASW32, linked to frontal migration and/or the variability of the southern hemisphere (SH) westerlies33,34.
Results and Discussion
Sea surface temperature variability over the last 300 kyr
At Site U1475, changes in UK′37-derived SST show a cyclic pattern that is synchronised with glacial-interglacial modulation, having mean SSTs between 16.7 and 22.3 °C during interglacial intervals (modern seasonal SST = 14 to 17 °C30) and between 15.8 and 21.9 °C during glacial periods (Fig. 2c). These variations exhibit larger amplitude between MIS 8 to 6, prior to Termination II (TII), and smaller shifts in SST values, after TII, from MIS 5 toward the present. Early cooling occurred at the glacial inceptions and coldest conditions are recorded before glacial maxima, with an early warming through the terminations (Fig. 2c). The early SST increase over the southern Agulhas Plateau relative to the Antarctic air temperature record (Vostok ice core) during the last 350 kyr35 has been also recorded at MD02-2588, a core located ~50 km southeast of our study area (Fig. 2b, d)25. Much cooler conditions during glacial stages occurred prior to TII, reaching highest temperature during the termination, and relatively constant SSTs for the rest of the studied interval. This cooling of the upper ocean may have been driven by the northward migration of the frontal systems, specifically the STF that lie to the south of the Agulhas Plateau, and is thus associated to the extent of the Antarctic ice sheet. This is supported by the good correspondence between δ18O and UK′37−
based SSTs of MD02-2588 and the deuterium (δD) record of the European Project for Ice Coring in Antarctica (EPICA) Antarctic ice core25, suggesting that the variations in surface and intermediate waters over the Agulhas Plateau are more likely linked to the glacial-interglacial climate oscillations in the SH rather than in the northern hemisphere (NH; Fig. 2a) during the last 300 kyr.
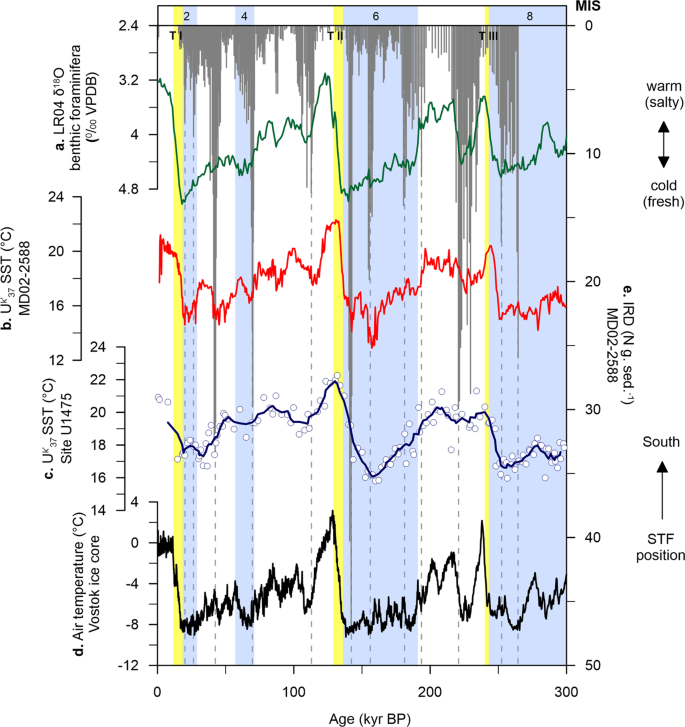
sea surface temperature (SST, red line)25. c Site U1475 UK′37
SST (blue line is the calculated five-point running average of the raw data (white circles) to highlight long-term trend). d Vostok ice core air temperature (black line)78. e MD02-2588 ice-rafted debris (IRD, grey bars)23. Light blue bars are glacial intervals (marine isotope stages, MIS)77. Yellow bars are glacial terminations (T)77,79,80.Full size image
Main alkenone synthesisers at the Agulhas Plateau
A total of 28 species and groups of coccolithophores were identified at Site U1475, comprising a mixture of taxa typical of tropical to subtropical environments (Supplementary Fig. 1). The assemblage is dominated by E. huxleyi (up to 62% of the assemblage; 4300 × 107 cm−2 kyr−1), Gephyrocapsa ericsonii (up to 55%; 8400 × 107 cm−2 kyr−1), and Florisphaera profunda (up to 52%; 3900 × 107 cm−2 kyr−1). These are followed by Gephyrocapsa caribbeanica (up to 44%; 6700 × 107 cm−2 kyr−1) and G. muellerae (up to 29%; 2900 × 107 cm−2 kyr−1), which altogether accounts for 58 to 93% of the total assemblage. Comparison between E. huxleyi and Gephyrocapsa species (G. oceanica, G. muellerae, G. ericsonii, G. caribbeanica) and concentrations and fluxes of C37:3-2 alkenones, displays individual distribution patterns among the species (Fig. 3). These results suggest that alkenones are potentially synthesised by different coccolithophore taxa over the last 300 kyr.
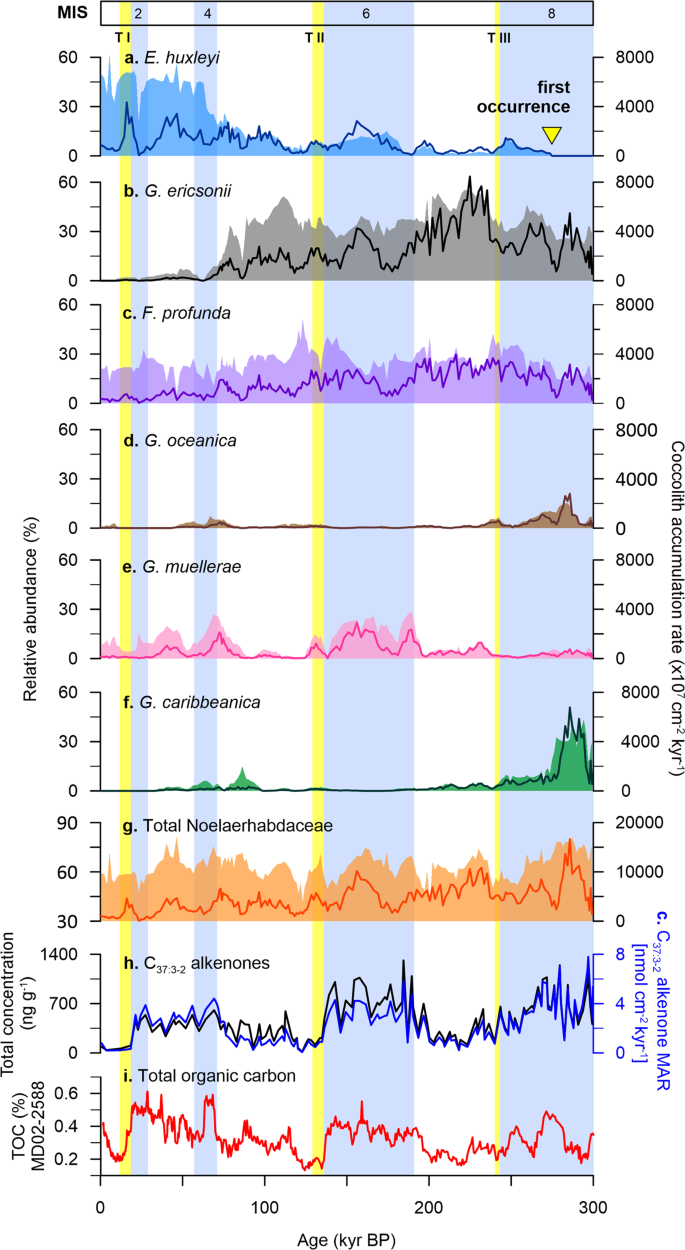
Prior to the first occurrence (FO) of E. huxleyi (~270 kyr; Fig. 3a)36, G. oceanica and G. caribbeanica appear to be the major alkenone producers (Fig. 3d, f), with minor contribution from other species of the Noelaerhabdaceae family (e.g. small Reticulofenestra) (Fig. 3g and Supplementary Fig. 1a). In modern deep-sea sediments, E. huxleyi is known as the main source of alkenone production16,37 and taxa that are morphologically related to E. huxleyi are considered potential biosynthesisers38. While it has been suggested that the FO of E. huxleyi in the geologic record is between 290 and 250 kyr36, alkenones have been recorded in sedimentary archives throughout the Palaeogene and Neogene38,39, and even in Cretaceous sediments40. Our results show coherency between alkenone concentrations and G. oceanica and G. caribbeanica during MIS 8, characterised by elevated alkenone concentrations (Fig. 3h) that are matched by high species abundances and fluxes (Fig. 3d, f). Lipids of species belonging to the genus Gephyrocapsa have been found to contain similar series of long-chain alkenones and other associated compounds as E. huxleyi, and are thus suggested as likely contributors to the alkenone record in deep-sea sediments prior to the FO of E. huxleyi38,41.
E. huxleyi started to register increased abundances during MIS 6, accompanied by an increase in G. muellerae and alkenone concentrations (Fig. 3a, e, f). After a decline in abundance immediately before and after TII, E. huxleyi dominates alkenone contribution at Site U1475 from the beginning of MIS 4 toward the present day (Fig. 3a). The shorter glacial intervals, stages 4 and 2 show a slight coincident increase in alkenones with contributions from E. huxleyi, G. muellerae and G. caribbeanica. After MIS 4, an abundance shift between E. huxleyi and G. ericsonii is observed, with G. ericsonii almost completely disappearing from the record (Fig. 3a, b). During this time, E. huxleyi, G. muellerae, and all the other Gephyrocapsa species are the likely alkenone synthesisers.
An interesting feature of the interglacial stages at the Agulhas Plateau over the last 300 kyr is the extremely low alkenone concentrations. Both MIS 7 and 5 register reduced alkenone concentrations, enhanced abundances of G. ericsonii and reduced abundances of all the other species (Fig. 3). The mismatch between the alkenones and the much smaller gephyrocapsid (G. ericsonii) suggests that alkenone production may not only be influenced by species abundance but by cell size as well. Without the contribution from larger Gephyrocapsa (G. caribbeanica, G. muellerae, G. oceanica), alkenone production is significantly lower during interglacial periods at the study site, despite the high numbers of G. ericsonii. The overall abundance pattern of G. ericsonii closely resembles that of F. profunda, an extant deep-dwelling species with an unknown alkenone production capability42 (Fig. 3b, c). However given the phylogenetic link of G. ericsonii to E. huxleyi43,44, it is unlikely that G. ericsonii is not producing alkenones just like F. profunda. This is also contrary to what is known about the Gephyrocapsa group being considered alkenone producers, although most of the previous studies only refer to G. oceanica alone38,44 or lump them altogether as Gephyrocapsa spp. Rather we speculate that G. ericsonii, given its smaller cell size, synthesises significantly smaller amounts of alkenones compared to other larger alkenone-producing coccolithophores. To our knowledge, there is no study yet directly linking coccolithophore cell size to alkenone production, although carbon isotopic fractionation from alkenones is thought to be strongly influenced by cell size45. The high abundances of G. ericsonii during interglacial periods can also be explained by the opportunistic nature of small placolith-bearing coccolithophores46, which would still bloom despite warmer upper ocean conditions. We therefore suggest that factors such as coccolithophore cell size, species-specific production of alkenones per coccolithophore cell under varying ecological upper ocean conditions (e.g. nutrient availability and light intensity), possible contribution from other haptophytes (e.g. Isochrysis), and differences in dissolution and preservation potential between alkenone and coccolith calcite may have been at play47,48.
Glacial-interglacial variability in C37:3-2 alkenones: production or preservation signal?
Alkenone concentration in sediments is a function of both the abundance of alkenone-producing phytoplankton in the upper water column and the preservation of organic matter, the latter being dependent on fluxes and redox conditions in the depositional environment49. In high latitude oceans where productivity is controlled by siliceous organisms, such as our study site at the Agulhas Plateau, remineralization of exported organic matter before reaching the seafloor is high50, and alkenone degradation during settling cannot be completely ruled out48. Here we found good correlation between C37:3-2 alkenone concentrations and C37:3-2 mass accumulation rates (MARs), suggesting that the observed variability in alkenone records reflect changes in upper ocean productivity rather than preservation changes due to varying sedimentation rates at the investigated site (Fig. 3h).
To further assess whether the alkenone signals at Site U1475 represent true records of production over the Agulhas Plateau, we compared our alkenone data with the total organic carbon (TOC) at MD02-2588 (Fig. 3i). Alkenone concentrations and fluxes are found to be significantly higher (or lower) during glacial (or interglacial) intervals, displaying similar pattern with TOC. The analogous trend between C37:3-2 alkenones and TOC burial fluxes observed in modern and fossil records indicates that the C37:3-2 alkenone record represents not only coccolithophore productivity, but of total phytoplankton production, as what has been also reported in other ocean basins48,49. This is emphasised by the coincidence between alkenone (Site U1475), coccolith (Site U1475) and siliceous (MD02-2588)25 records at the Agulhas Plateau (Fig. 4c, e–g). In fact, at Site U1475, coccolithophores appear to significantly contribute to both glacial and interglacial phytoplankton productions, whereas diatoms only dominate during glacial intervals, with a distinct shift in dominance between the two groups beginning at TII (Fig. 4f–g). This correspondence between calcareous and siliceous productivity and C37:3-2 alkenones provides additional robust evidence of good preservation and that the observed glacial-interglacial productivity pattern is not skewed by post deposition diagenesis; rather productivity is driven by physical factors like atmospheric and oceanographic processes discussed in the succeeding sections.
Productivity drivers over the Agulhas Plateau
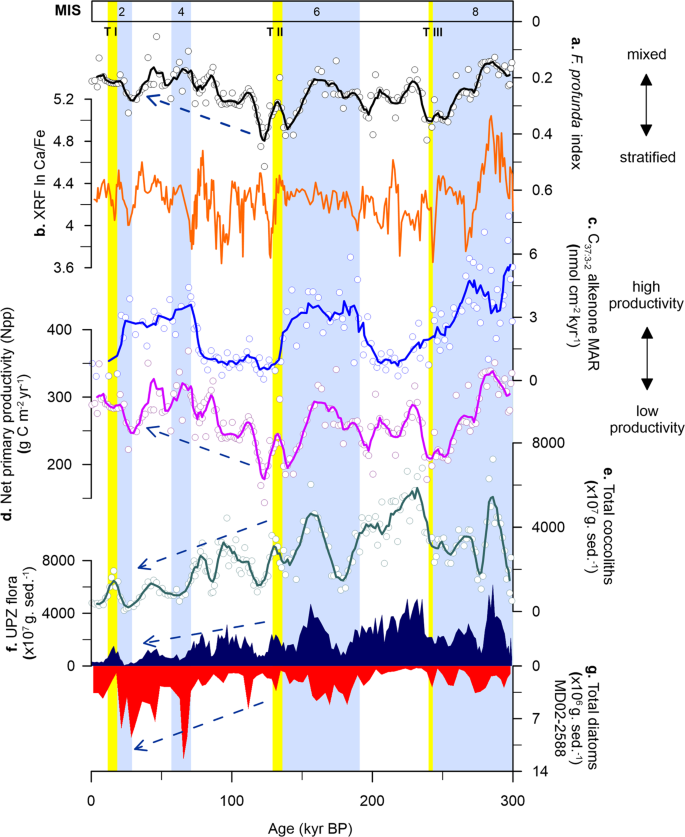
Local nutrient supply and export productivity in the southern Indian Ocean are inferred to be driven by the migrating Southern Ocean fronts, specifically the STF, over the last 900 kyr e.g.,18,25,26,51. Within this region, repeated equatorward STF shifts between 4° (ref. 51) and 7° (ref. 18) latitudes occurred during glacial periods. Site U1475 is located in close proximity to the present-day position of the STF and is thus well-positioned to track its meridional migration, and the subsequent impacts on water column properties over glacial-interglacial timescales. Our C37:3-2 alkenone concentrations and net primary productivity (Npp)52 records show that enhanced productivity occurred during glacial stages 8, 6 and 2, with minima coincident with each termination (Fig. 4c, d). Productivity at Site U1475 reconstructed from alkenones and coccoliths is at a minimum during terminations and SST rises before the glacial maximum, indicating that the STF likely moves southward before the interglacial intervals.
At Site U1475, C37:3-2 alkenone concentrations vary from 16 to 1315 ng g−1, with highest values recorded during MIS 8 and 6 (Fig. 3h), coinciding with a more intense water column mixing as observed from the F. profunda index (Fig. 4a). The northward STF shift, evidenced by decreasing SST (Fig. 2b, c), likely promoted productivity by increasing nutrient input in the photic layer via: (1) vertical mixing, bringing cold nutrient-rich waters from the mixed layer to the surface and (2) lateral advection, expanding the pool of nutrients of the SASW to the Agulhas Plateau, with the latter thought to be the primary control of nutrient supply in modern Southern Ocean32. The equatorward expansion of the SASW is supported by ice-rafted debris (IRD) record of MD02-2588, showing greater IRD deposition during lower SSTs (Fig. 2e)23,53. With the expansion of SASW during glacial episodes as a consequence of a more northerly STF, a weaker upper ocean stratification and higher nutrient concentrations occurred at Site U1475, which has been corroborated by earlier studies in the southern Indian Ocean22,25,26. This high productivity conditions during glacials led to the increased concentrations of coccolithophore taxa adapted to colder and/or high nutrient environments (e.g. E. huxleyi, G. muellerae, G. caribbeanica, G. oceanica) (Supplementary Fig. 1).
During interglacial stages, when the STF is at its southerly position, reduced concentrations of C37:3-2 alkenones are recorded, starting from MIS 7 (Fig. 4c). From MIS 5 to 1, alkenone concentrations maintain a relatively constant level with a slight increase during MIS 3, and having a maximum of only about half of the highest recorded glacial concentrations (606 ng g−1) found in MIS 8 and 6. Reduced alkenone production observed during interglacials should parallel lower total coccolithophore productivity. However this is contrary to the high primary productivity during the interglacial periods in our record, calculated from the relative abundance of the lower photic zone (LPZ) species F. profunda (Npp; Fig. 4d). During interglacials, the STF is located further south, and previous studies show that nutrient supply is lower, suggesting a reduction in the influence of SASW and greater influence of the Indian Ocean surface waters transported by the ARC. The southward shift of the STF would have also reduced vertical mixing, thus enhancing water column stratification that is typical of the subtropical waters. This stronger stratification resulted in increased abundance of F. profunda. As previously pointed out, despite the differences in depth habitat, G. ericsonii (upper photic zone, UPZ) appears to have a similar pattern with F. profunda (LPZ) throughout the record, i.e. having distinct peaks during interglacials (Fig. 3b, c). This indicates that while there is an enhancement of stratification during interglacial intervals, there is still a steady supply of nutrients available in the surface waters at Site U1475. These factors, together with SST, influenced the abundance of G. ericsonii and F. profunda in the photic layer. Furthermore, the two aforementioned species are typical of the tropical Indian Ocean waters, which further support the lesser influence of SASW and greater influence of the AC during interglacial episodes26. Nevertheless, the increase in abundances of F. profunda and G. ericsonii cannot be simply explained by an enrichment of nutrients in the water column, since other species with an affinity for high nutrient setting did not respond to the enrichment nor have a notable impact on the alkenone production, which is an indicator of high productivity. Our results therefore add alternative support on the proposed ecological preference and temperature sensitivity of F. profunda in higher latitudes, above 30°N and 30°S52.
In addition to the distinct long-term glacial-interglacial cycles observed in the investigated site, our coccolithophore productivity record shows notable shorter-term variability at higher frequencies, which cannot be attributed to the long-term frontal migration (Fig. 5 and Supplementary Figs. 2, 3). Here we have compared our record to the NH (65°N), SH (65°S) and local (40°S) maximum summer insolation intensities (Fig. 5a, h, i)54. Being photosynthetic, coccolithophores respond to both light and temperature changes in the water column, therefore changes in insolation intensity could affect their seasonal behaviour. Insolation intensity is a consequence of the combined variabilities in Earth’s orbital parameters (eccentricity, obliquity and precession)54, and directly influences the amount of light and temperature conditions in the upper ocean. Comparison between the timing of productivity peaks to insolation maxima reveals that at Site U1475, coccolithophore communities are responding more to the local (40°S) and SH summer insolation. In particular, the UPZ coccolithophore community shows distinct peaks during insolation maxima (Fig. 5b), indicating that the upper water column conditions over the Agulhas Plateau is influenced by insolation intensity in high latitudes, specifically the SH, driving seasonal variability in the upper ocean biotic communities.
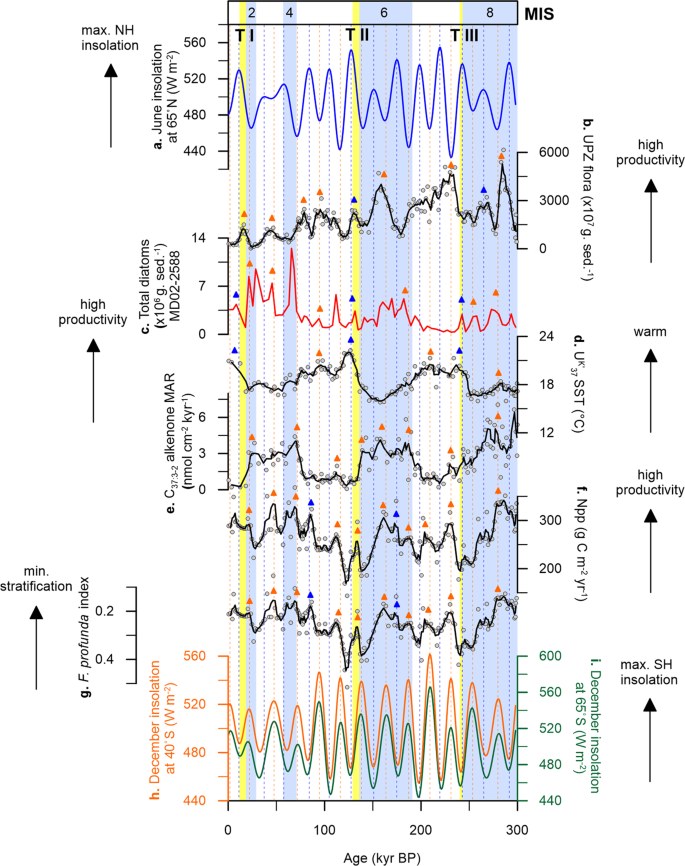
sea surface temperature (SST, black). e C37:3-2 alkenone mass accumulation rate (MAR, black). f Net primary productivity (Npp, black). g Florisphaera profunda index (black). h Maximum summer insolation at Site U1475 (40°S, orange)54. i maximum summer insolation at the southern hemisphere (SH, 65°S, green)54. The coloured arrows represent coincidence between our records and summer insolation maxima in the NH (blue) and SH (orange). Solid lines are calculated five-point running average of the raw data (white circles) to highlight long-term trends. Light blue bars are glacial intervals (marine isotope stages, MIS)77. Yellow bars are glacial terminations (T)77,79,80.Full size image
Reconstructed productivity records from both geochemistry (C37:3-2 alkenone abundances and MARs) and independent coccolith data also reveal dominant periodicities (significant at 95% confidence interval, CI) related to the 100-kyr eccentricity (Supplementary Figs. 2 and 3). Weaker spectral peaks at 41- and 23-kyr periodicities are recorded for alkenones and primary productivity, corresponding to obliquity and precession, respectively. A total absence of obliquity signal is found in the record of total coccolith abundance as well as on the assemblage-derived productivity (Npp), and water column stratification proxies (F. profunda index) (Supplementary Fig. 2a, c, d). Peaks in the alkenone record show a strong positive response to SH insolation throughout the record (Fig. 5e), with highest productivity during periods of SH insolation maxima. Moreover, primary productivity (Fig. 5f) and water column stratification (Fig. 5g) also display a positive response to enhanced summer insolation in the SH over the past 300 kyr. Comparing our coccolith data to the published diatom productivity record at the Agulhas Plateau reveals that diatoms are responding more to orbital and sub-orbital variability although showing weaker power at the 41-kyr frequency (Supplementary Fig. 2b). Coccolithophores and diatoms display modest peaks at sub-precession (19 kyr) and precession (23 kyr) (Supplementary Fig. 2a, b), with abundances that appear to be controlled by the SH insolation maxima.
Significance of Termination II at Site U1475
Termination II (MIS 6/5 transition) at the studied site represents a major shift in both SST and productivity records at a regional scale (Figs. 2–5). It is characterised by the boundary between two long-term climate cycles at a global scale55. Previous studies at a nearby location (MD02-2588) showed that UK′37
SST at the Agulhas Plateau reached its maximum temperature (~22 °C) for the entire 300 kyr interval during TII (Fig. 2b)25. Our data indicates that TII marks the limit from a stratified water column to a progressive and continuous water column mixing, as seen from the F. profunda index (Fig. 4a). Reconstructed primary productivity is also markedly affected by this transition and shifted from an in-phase pattern with glacial-interglacial variability (high during MIS 8 and MIS 6) to a total lack of congruence to glacial-interglacial cycles after TII (Fig. 4c, d). Moreover, diatoms show much higher concentrations after TII (MIS 4 and 2) (Fig. 4g)25 when the UPZ coccolithophore species started to continuously decline (Fig. 4f). TII also represents a prominent change in the orbital periodicities of several palaeoenvironmental proxies (Supplementary Figs. 2 and 3). Productivity proxies (i.e. C37:3-2 alkenones, coccoliths) show marked eccentricity frequencies (100 kyrs) preceding TII, but the cyclicity in the data either disappeared or attenuated after this period. In addition, the Ca/Fe ratio (Fig. 4b), a proxy associated with marine carbonate production versus fluvial input in many circum-African margins56,57 and South African marine basins58, is only sensitive to obliquity cycle after TII (Supplementary Fig. 3c).
TII marks a step-change in water column conditions and forcing, from an eccentricity-dominated signal to a stronger obliquity influence over Site U1475. We therefore suggest that an increase in the interaction between the warm and salty ARC with the cold SASW occurred during TII. Obliquity is the dominant forcing in the greater AC system59 and after TII the STF was positioned further north22. Sediment core MD02-2588, located ~50 km eastward at the same latitude also suggests that the northward migration of the STF preceded and probably forced strengthened the AC and ARC based on an abrupt increase in Globigerina bulloides and other planktic foraminifera during MIS 4 and 2, suggesting high productivity events60. When compared to the entire sedimentary sequence recovered at Site U1475, the TII boundary is associated with the only lithogenic variation recognised for the last 5.3 Myr, and represents a change from light greenish or pale grey to white-grey nannofossil ooze (Unit II 4.75–277.22 m CSF-A) to a of pale brown, light greenish or olive-grey, and white-grey nannofossil-rich foraminifer ooze (Unit I 0–4.75 m CSF-A)28. This shift during TII has major implications for the surface water conditions over the Agulhas Plateau because increased recirculation of the tropical AC waters would transmit tropical signal to the southern Indian Ocean and the Pacific Ocean. We suggest that this can be linked to the recognised NH signature in regions of the subtropical convergence, such as our study site at the Agulhas Plateau61.
Implications for the southern Indian Ocean biological pump
The role of coccolithophores in marine carbon cycle as a dominant calcifying phytoplankton, varies greatly from that of other primary producers (e.g. diatoms) in the upper ocean, with coccolithophores being able to alter both the biological (photosynthesis) and carbonate (calcification) pumps. This global carbon pump is significantly influenced by the efficiency of the two dominant phytoplankton groups in the Southern Ocean by contributing to CO2 release via calcification (by coccolithophores) and CO2 uptake via photosynthesis (by coccolithophores and diatoms)49. The combination of coccolithophore and diatom primary production signals therefore strongly reflects the relative strength and efficiency of biogenic carbon export to the deep ocean (biological pump)10, especially in high latitude regions dominated by siliceous productivity, such as Site U1475 at the Agulhas Plateau.
Here we show that the high glacial export productivity over the Agulhas Plateau indicated by coccolith abundances and C37:3-2 alkenones, tied to published records of diatoms and TOC provides new evidence of a more efficient and strengthened biological pump in the Southern Ocean sector of the Indian Ocean during glacial periods. This is consistent with the pattern seen in the southern Indian Ocean records showing a global decline of pCO2 during glacials3,6, which the authors linked to the increased efficiency of Southern Ocean biological pump62 stimulated by increased deposition of dust into the Southern Ocean63. It is thought that the dust-induced Fe fertilisation during glacials drove Si uptake by diatoms resulting in high production over the Agulhas Plateau3,25. Similarly, coccolithophores show positive response to the upper water column enrichment during the glacials (Fig. 4d–f). The consistent decline in the coccolith record beginning at TII in the southern Indian Ocean, and the observed shift from a coccolithophore-dominated to a diatom-dominated phytoplankton community could thus indicate a more efficient release of CO2 to the atmosphere (carbonate pump).
Although our understanding of the ocean—atmosphere CO2 exchange and its link to the global climate system remains a major challenge, a number of studies already showed that phytoplankton communities in the Southern Ocean plays a key role in these processes. Thus further studies exploring past biotic responses in the Southern Ocean is necessary in order to obtain a clearer picture of the role of phytoplankton on the global carbon cycle and its consequent impact on pCO2 variability.
Methods
Sampling strategy
For this study, we used the upper ~8 m of the ~290 m stratigraphic splice at Site U1475, representing the last 300 kyr. We focus on the interval from the FO of E. huxleyi (~270 kyr in the Indian Ocean)36 in order to minimise species evolutionary bias, since older interval comprises a different assemblage composition. Sampling interval was selected using the shipboard age model estimated from combined biostratigraphy and magnetostratigraphy28. Cores in the splice were sampled every 4 and 8 cm intervals, targeting a time resolution of ~1.5 and ~3 kyr for micropaleontological and biomarker analyses, respectively. A total of 201 samples were analysed for full coccolith assemblage composition and 141 samples for alkenone concentrations and SST.
X-ray fluorescence (XRF) core scanning
The ~256-m-long splice at Site U1475 was scanned using a third generation Avaatech Core Scanner with a Canberra X-PIPS SDD, Model SXD 15C-150-500 150 eV resolution X-ray detector at the XRF Core Scanning Facility, IODP Gulf Coast Repository, College Station, Texas, USA. All core sections were scraped to clean the split core surface and covered with 4 µm –thick Ultralene plastic film (SPEX Centriprep, Inc.) prior to scanning. Data were collected every 3 cm down-core in three separate runs using generator settings of 10 kV/0.25 mA (no filter), 30 kV/1.25 mA (Pd-filter) and 50 kV/1.5 mA (Cu-filter), respectively. With the 10 kV setting, elements in the range from Al to Fe are detected, while at 30 kV, elements Rb, Sr and Zr are best resolved. Ba was measured with the 50 kV setting. For this study, we have only used the Ca and Fe data.
Age model construction
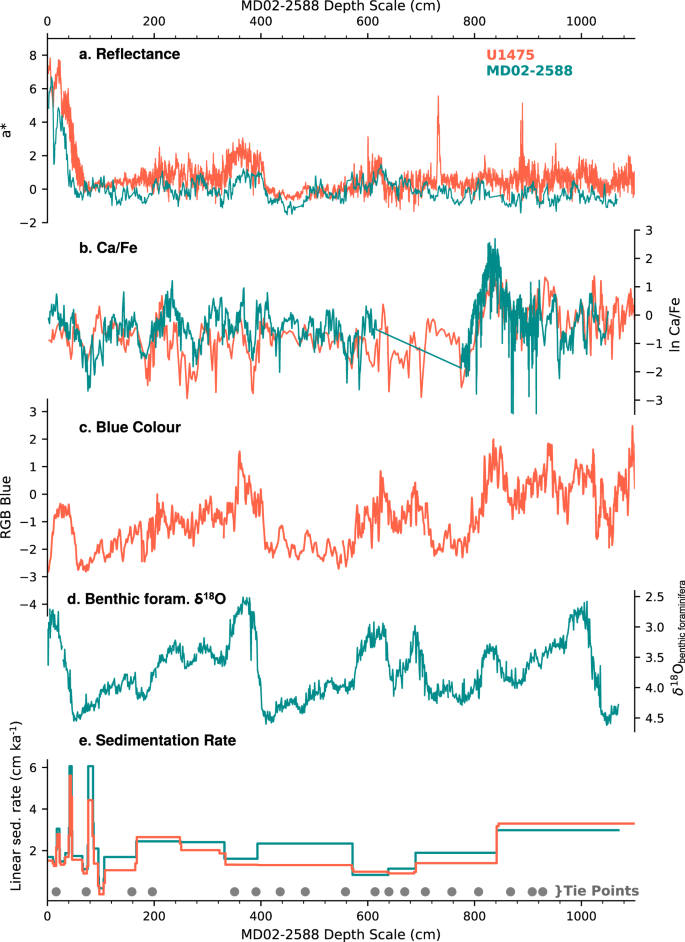
The studied interval is anchored upon the FO of E. huxleyi at 270 ka36 using the shipboard biostratigraphic results. The shipboard age model was refined by aligning records of sediment reflectance (a*, L*), and XRF Ca/Fe ratio from Site U1475 to the respective records from the nearby core MD02-2588 (n = 18 tie points) (Fig. 6). The robustness of this alignment was then confirmed by comparing the Site U1475 sediment colour (blue band) to the MD02-2588 benthic δ18O curve3 (Fig. 6c, d). The published MD02-2588 age model3 was then applied to the equivalent interval of Site U1475. This age model, consisting of radiocarbon dates and tie points between benthic foraminiferal δ18O to the EPICA Dome C temperature record64 on the EDC3 chronology65, yields an average sedimentation rate of 2.67 cm kyr−1, ranging from 1 to 6.7 cm kyr−1, comparable to the average sedimentation rate at MD02-2588 (3.40 cm kyr−1)3, and the initial shipboard estimate at Site U1475 (2.8 cm kyr−1)28.
The FO of E. huxleyi was noted at 687.7 cm, and is placed at 273 kyr (Fig. 3a). Other significant biostratigraphic events recorded are the crossover dominance between G. ericsonii and G. caribbeanica, which is synchronous with the E. huxleyi FO (Fig. 3b, f), and between G. ericsonii and E. huxleyi at 160.5 cm at 72 kyr (Fig. 3a, b). The FO of E. huxleyi is a well-documented event among ocean basins dated between 290 and 250 kyr66, with the species becoming significantly abundant during MIS 5 from 85 to 73 kyr at low latitudes, and during MIS 4 at high latitudes36,66.
Molecular biomarker and sea surface temperature
To examine productivity and determine SSTs, alkenones were extracted from freeze-dried, homogenised sediment samples (an average of 11 g dry weight) using an Accelerated Solvent Extractor (Dionex ASE 350). A solvent mixture of 9:1 (v:v) dichloromethane (DCM): methanol (MeOH) was used to obtain an initial total lipid extract (TLE). The TLE was then separated into apolar, neutral, polar fractions with alumina oxide (Al2O3) column chromatography, using 9:1 hexane/DCM (v:v), 1:1 hexane/DCM (v:v) and 1:1 DCM/MeOH (v:v) as eluents, respectively. C37:3-2 alkenones were calculated using total concentrations of C37:2 and C37:3 ketones per unit dry weight of sediment, determined by referencing the ketone peak areas to the added internal reference standard 5α-Androstane (Sigma-Aldrich). Samples were identified and quantified using a Thermo Scientific Trace 1310 GC-FID coupled to an ISQ MS system. The Trace 1310 GC was equipped with a Rtx-5 column (60 m × 0.25 mm × 0.25 µm) using a temperature programme that started at 70 °C (1 min hold), then a temperature ramp of 20 °C per minute to 130 °C, followed by 4 °C per minute ramp to 320 °C, where it was held for 20 min.
C37:3-2 MARs were calculated using Eq. (1). The dry bulk density (DBD) data was derived from shipboard measurements of gamma ray attenuation, which has been cleaned and corrected67.MARs=C37:3−2alkenone×sedimentationrate×DBD (1)
The unsaturation index UK′37
was calculated using Eq. (2)68:UK′37=C37:2C37:2+C37:3 (2)
Subsequently, SSTs were determined using the core top calibration following Eq. (3)17, which spans the temperature range of 0 to 27 °C and has a calibration error of ±1.5 °C. Reproducibility based on replicate analysis of samples is ±0.04 °C.UK′37=0.033(SST)+0.044 (3)
Micropaleontological analysis
Samples were prepared for coccolithophore (coccolith) assemblage analysis following the combined dilution-filtering technique69 and analysed under a Zeiss DSM940A scanning electron microscope at 3000X magnification. At least 500 specimens were identified and counted on measured transects for each sample. Species identification was based upon the electronic guide to biodiversity and taxonomy of coccolithophores (Nannotax 3; https://www.mikrotax.org/Nannotax3/). Coccolith counts (CC) are expressed as number of coccoliths per gram of sediments (number g sed.−1), calculated using Eq. (4), where F = effective filtration area (mm2), C = number of counted coccoliths, S = split factor, A = investigated filter area (mm2) and W = weight of sample (g).CC=(F×C×S)/(A×W) (4)
The CCs were then converted to coccolith accumulation rates (CARs) following Eq. (5). The DBD values used for calculating alkenone fluxes (MARs) were also applied in the calculation of CARs.CARs=NC×sedimentationrate×DBD (5)
Species diversity (Shannon index; H) was calculated using the palaeontological statistics software (PAST)70. The ratio between the deep-dwelling species F. profunda and shallow-dwelling taxa E. huxleyi and G. ericsonii11 was used to monitor past variations in nutricline depths and water column stratification at the Agulhas Plateau. Here we modified the F. profunda index formula71 and calculated the abundance of the LPZ taxon F. profunda against all UPZ species (E. huxleyi, gephyrocapsids, reticulofenestrids) to minimise species evolutionary bias on the stratification index (6). Low values of F. profunda index suggest a mixed water column (shallow nutricline) while values closer to 1 indicate a stratified water column (deep nutricline).F.profundaindex=LPZLPZ+UPZ (6)
Past primary productivity expressed in grams of carbon (g C m−2 yr−1) was calculated using the Npp equation calibrated using F. profunda global data52 (7):log10(Npp)=3.11−0.01∗%F.profunda (7)
Time series analysis
In order to detect astronomical and orbital periodicities within the past productivity and oceanographic records, a continuous wavelet transform was performed using a Mortlet wavelet72 in PAST version 3.25. Prior to the analysis, the unevenly-spaced data was interpolated based on the average resolution of each dataset: 1 kyr for Ca/Fe ratios; 1.5 kyr for the coccolith assemblage; 2 kyr for SST and alkenones; and 3.5 kyr for diatoms. To test the significance of the spectrum peaks against the red-noise background, we performed spectral analysis for unevenly-spaced data using the REDFITX software73. The REDFIT package allows analysis of an unevenly-spaced dataset without interpolating the raw data to generate an evenly-spaced time series.
Data availability
All data related to this article is archived in the PANGAEA database: https://doi.pangaea.de/10.1594/PANGAEA.912467.
References
- 1.Mackensen, A. Changing Southern Ocean palaeocirculation and effects on global climate. Antarctic Science 16, 369–386 (2004).Article Google Scholar
- 2.Orsi, A. H., Whitworth, T. & Nowlin, W. D. On the meridional extent and fronts of the Antarctic circumpolar current. Deep Sea Res. Part I: Oceanogr. Res. Pap. 42, 641–673 (1995).Article Google Scholar
- 3.Ziegler, M., Diz, P., Hall, I. R. & Zahn, R. Millennial-scale changes in atmospheric CO2 levels linked to the Southern Ocean carbon isotope gradient and dust flux. Nature Geoscience 6, 457–461 (2013).CAS Article Google Scholar
- 4.Read, J., Lucas, M., Holley, S. & Pollard, R. Phytoplankton, nutrients and hydrography in the frontal zone between the Southwest Indian Subtropical gyre and the Southern Ocean. Deep Sea Res. Part I: Oceanogr. Res. Pap. 47, 2341–2367 (2000).CAS Article Google Scholar
- 5.Arrigo, K. R. et al. Phytoplankton community structure and the drawdown of nutrients and CO2 in the southern ocean. Science 283, 365–367 (1999).CAS Article Google Scholar
- 6.Anderson, R. F. et al. Wind-driven upwelling in the Southern Ocean and the deglacial rise in atmospheric CO2. Science 323, 1443–1448 (2009).CAS Article Google Scholar
- 7.Jaccard, S. L. et al. Two modes of change in Southern Ocean productivity over the past million years. Science 339, 1419–1423 (2013).CAS Article Google Scholar
- 8.Toggweiler, J. R., Russell, J. L. & Carson, S. R. Midlatitude westerlies, atmospheric CO2, and climate change during the ice ages. Paleoceanography https://doi.org/10.1029/2005pa001154 (2006).
- 9.Matsumoto, K. & Sarmiento, J. L. A corollary to the silicic acid leakage hypothesis. Paleoceanography https://doi.org/10.1029/2007pa001515 (2008).
- 10.Rost, B. & Riebesell, U. Coccolithophores and the biological pump: responses to environmental changes. In: Coccolithophores – From Molecular Processes to Global Impact (eds Thierstein, H. R. & Young, J. R.). Springer, Berlin, pp. 99–125 (2004).
- 11.Winter, A., Jordan, R. W. & Roth, P. H. in Coccolithophores (eds Winter A. & Siesser W. G.) (Cambridge Univ. Press, 1994).
- 12.Baumann, K. H. & Freitag, T. Pleistocene fluctuations in the northern Benguela Current system as revealed by coccolith assemblages. Mar. Micropaleontol. 52, 195–215 (2004).Article Google Scholar
- 13.Deppeler, S. L. & Davidson, A. T. Southern Ocean Phytoplankton in a Changing Climate. Front. Marine Sci. https://doi.org/10.3389/fmars.2017.00040 (2017).
- 14.Malinverno, E., Triantaphyllou, M. V. & Dimiza, M. D. Coccolithophore assemblage distribution along a temperate to polar gradient in the West Pacific sector of the Southern Ocean (January 2005). Micropaleontol. https://www.jstor.org/stable/44511372 (2015).
- 15.Stoll, H. M. & Ziveri, P. Coccolithophores (Springer, 2004).
- 16.Brassell, S. C., Eglinton, G., Marlowe, I. T., Pflaumann, U. & Sarnthein, M. Molecular stratigraphy: a new tool for climatic assessment. Nature 320, 129–133 (1986).CAS Article Google Scholar
- 17.Müller, P. J., Kirst, G., Ruhland, G., von Storch, I. & Rosell-Melé, A. Calibration of the alkenone paleotemperature index U37K′ based on core-tops from the eastern South Atlantic and the global ocean (60°N-60°S). Geochimica et Cosmochimica Acta 62, 1757–1772 (1998).Article Google Scholar
- 18.Bard, E. & Rickaby, R. E. Migration of the subtropical front as a modulator of glacial climate. Nature 460, 380–383 (2009).CAS Article Google Scholar
- 19.Lutjeharms, J. R. E. The Agulhas Current (Springer-Verlag, 2006).
- 20.Lutjeharms, J. R. E. & Ansorge, I. J. The Agulhas return current. J. Marine Syst. 30, 115–138 (2001).Article Google Scholar
- 21.Graham, R. M. & De Boer, A. M. The dynamical subtropical front. J. Geophys. Res. Oceans 118, 5676–5685 (2013).Article Google Scholar
- 22.Peeters, F. J. et al. Vigorous exchange between the Indian and Atlantic oceans at the end of the past five glacial periods. Nature 430, 661–665 (2004).CAS Article Google Scholar
- 23.Marino, G. et al. Agulhas salt-leakage oscillations during abrupt climate changes of the Late Pleistocene. Paleoceanography 28, 599–606 (2013).Article Google Scholar
- 24.Martínez-Méndez, G. et al. Contrasting multiproxy reconstructions of surface ocean hydrography in the Agulhas Corridor and implications for the Agulhas Leakage during the last 345,000 years. Paleoceanography https://doi.org/10.1029/2009PA001879 (2010).
- 25.Romero, O. E. et al. High-latitude forcing of diatom productivity in the southern Agulhas Plateau during the past 350 kyr. Paleoceanography 30, 118–132 (2015).Article Google Scholar
- 26.Flores, J. A., Gersonde, R. & Sierro, F. J. Pleistocene fluctuations in the Agulhas Current Retroflection based on the calcareous plankton record. Mar Micropaleontol. 37, 1–22 (1999).Article Google Scholar
- 27.Diz, P., Hall, I. R., Zahn, R. & Molyneux, E. G. Paleoceanography of the southern Agulhas Plateau during the last 150 ka: inferences from benthic foraminiferal assemblages and multispecies epifaunal carbon isotopes. Paleoceanography https://doi.org/10.1029/2007PA001511 (2007).
- 28.Hall, I. R. et al. in South African Climates (Agulhas LGM Density Profile) (eds Hall I. R., Hemming, S. R., LeVay, L. J. & the Expedition 361 Scientists) (International Ocean Discovery Program, 2017).
- 29.Holliday, N. P. & Read, J. F. Surface oceanic fronts between Africa and Antarctica. Deep Sea Res. Part I: Oceanogr. Res. Pap. 45, 217–238 (1998).Article Google Scholar
- 30.Acker, J. G. & Leptoukh, G. Online analysis enhances use of NASA earth science data. Eos, Trans. Am. Geophys. Union 88, 14–17 (2007).Article Google Scholar
- 31.Patil, S. M. et al. Biogeographic distribution of extant Coccolithophores in the Indian sector of the Southern Ocean. Marine Micropaleontol. 137, 16–30 (2017).Article Google Scholar
- 32.Sigman, D. M., Altabet, M. A., Francois, R., McCorkle, D. C. & Gaillard, J. F. The isotopic composition of diatom‐bound nitrogen in Southern Ocean sediments. Paleoceanography 14, 118–134 (1999).Article Google Scholar
- 33.Kohfeld, K. et al. Southern hemisphere westerly wind changes during the last glacial maximum: paleo-data synthesis. Quat. Sci. Rev. 68, 76–95 (2013).Article Google Scholar
- 34.De Boer, A. M., Graham, R. M., Thomas, M. D. & Kohfeld, K. E. The control of the Southern Hemisphere Westerlies on the position of the Subtropical Front. J. Geophys. Res. Oceans 118, 5669–5675 (2013).Article Google Scholar
- 35.Cortese, G., Abelmann, A. & Gersonde, R. The last five glacial-interglacial transitions: A high-resolution 450,000-year record from the subantarctic Atlantic. Paleoceanography https://doi.org/10.1029/2007pa001457 (2007).
- 36.Thierstein, H. R., Geitzenauer, K. R. & Molfino, B. Global synchroneity of late quaternary coccolith datum levels – validation by oxygen isotopes. Geology 5, 400–404 (1977).CAS Article Google Scholar
- 37.Conte, M. H. et al. Lipid biomarkers of the Haptophyta. The haptophyte algae, 351–377 (1994).
- 38.Marlowe, I. T., Brassell, S. C., Eglinton, G. & Green, J. C. Long-chain alkenones and alkyl alkenoates and the fossil coccolith record of marine sediments. Chemical Geol. https://doi.org/10.1016/0009-2541(90)90098-R (1990).
- 39.Marlowe, I. T. et al. Long chain (n-C37–C39) alkenones in the Prymnesiophyceae. Distribution of alkenones and other lipids and their taxonomic significance. Br. Phycol. J. https://doi.org/10.1080/00071618400650221 (1984).
- 40.Farrimond, P., Eglinton, G. & Brassell, S. C. Alkenones in cretaceous black shales, Blake-Bahama Basin, western North Atlantic. Org. Geochem. 10, 897 (1986).CAS Article Google Scholar
- 41.Volkman, J. K., Barrerr, S. M., Blackburn, S. I. & Sikes, E. L. Alkenones in Gephyrocapsa oceanica: implications for studies of paleoclimate. Geochimica et Cosmochimica Acta 59, 513–520 (1995).CAS Article Google Scholar
- 42.Brand, L. Physiological ecology of marine. Coccolithophores 39 (2006).
- 43.Bendif, E. M. et al. Repeated species radiations in the recent evolution of the key marine phytoplankton lineage Gephyrocapsa. Nat. Commun. 10, 4234 (2019).Article CAS Google Scholar
- 44.Conte, M. H., Thompson, A., Eglinton, G. & Green, J. C. Lipid biomarker diversity in the Coccolithophorid Emiliania Huxleyi (Prymnesiophyceae) and the related species Gephyrocapsa Oceanica1. J. Phycol. 31, 272–282 (1995).CAS Article Google Scholar
- 45.Henderiks, J. & Pagani, M. Coccolithophore cell size and the Paleogene decline in atmospheric CO2. Earth Planet. Sci. Lett. 269, 576–584 (2008).Article CAS Google Scholar
- 46.Okada, H. & Wells, P. Late quaternary nannofossil indicators of climate change in two deep-sea cores associated with the Leeuwin Current off Western Australia. Palaeogeogr. Palaeoclimatol. Palaeoecol. 131, 413–432 (1997).Article Google Scholar
- 47.Malinverno, E., Prahl, F. G., Popp, B. N. & Ziveri, P. Alkenone abundance and its relationship to the coccolithophore assemblage in Gulf of California surface waters. Deep Sea Res. Part I: Oceanogr. Res. Pap. 55, 1118–1130 (2008).Article Google Scholar
- 48.Prahl, F. G., de Lange, G. J., Lyle, M. & Sparrow, M. A. Post-depositional stability of long-chain alkenones under contrasting redox conditions. Nature 341, 434–437 (1989).CAS Article Google Scholar
- 49.Bolton, C. T. et al. Glacial–interglacial productivity changes recorded by alkenones and microfossils in late Pliocene eastern equatorial Pacific and Atlantic upwelling zones. Earth Planet. Sci. Lett. 295, 401–411 (2010).CAS Article Google Scholar
- 50.Francois, R., Honjo, S., Krishfield, R. & Manganini, S. Factors controlling the flux of organic carbon to the bathypelagic zone of the ocean. Global Biogeochem. Cy. 16, 34-31–34-20 (2002).Article CAS Google Scholar
- 51.Rau, A. et al. A 450-kyr record of hydrological conditions on the western Agulhas Bank Slope, south of Africa. Mar. Geol. 180, 18 (2002).Article Google Scholar
- 52.Hernández-Almeida, I., Ausín, B., Saavedra-Pellitero, M., Baumann, K. H. & Stoll, H. M. Quantitative reconstruction of primary productivity in low latitudes during the last glacial maximum and the mid-to-late Holocene from a global Florisphaera profunda calibration dataset. Quat. Sci. Rev. 205, 166–181 (2019).Article Google Scholar
- 53.Simon, M. H. et al. Millennial-scale Agulhas Current variability and its implications for salt-leakage through the Indian-Atlantic Ocean Gateway. Earth Planet. Sci. Lett. 383, 101–112 (2013).CAS Article Google Scholar
- 54.Laskar, J., Fienga, A., Gastineau, M. & Manche, H. La2010: a new orbital solution for the long-term motion of the Earth. Astron. Astrophys. 532, 15 (2011). Google Scholar
- 55.Martrat, B. et al. Four climate cycles of recurring deep and surface water destabilizations on the Iberian Margin. Science 317, 502–507 (2007).CAS Article Google Scholar
- 56.Dickson, A. J., Leng, M. J., Maslin, M. A. & Röhl, U. Oceanic, atmospheric and ice-sheet forcing of South East Atlantic Ocean productivity and South African monsoon intensity during MIS-12 to 10. Quat. Sci. Rev. 29, 3936–3947 (2010).Article Google Scholar
- 57.Revel, M. et al. 20,000 years of Nile River dynamics and environmental changes in the Nile catchment area as inferred from Nile upper continental slope sediments. Quat. Sci. Rev. 130, 200–221 (2015).Article Google Scholar
- 58.Caley, T. et al. A two-million-year-long hydroclimatic context for hominin evolution in southeastern Africa. Nature 560, 76–79 (2018).CAS Article Google Scholar
- 59.Caley, T. et al. High-latitude obliquity forcing drives the Agulhas leakage. Clim. Past Discuss. 7, 2193–2215 (2011). Google Scholar
- 60.Naik, D. K., Saraswat, R., Khare, N., Pandey, A. C. & Nigam, R. Hydrographic changes in the Agulhas recirculation region during the late auaternary. Clim. Past 10, 745–758 (2014).Article Google Scholar
- 61.Pahnke, K., Zahn, R., Elderfield, H. & Schulz, M. 340,000-year centennial-scale marine record of southern hemisphere climatic oscillation. Science 301, 948–952 (2003).CAS Article Google Scholar
- 62.Sigman, D. M. & Boyle, E. A. Glacial/interglacial variations in atmospheric carbon dioxide. Nature 407, 859–869 (2000).CAS Article Google Scholar
- 63.Martínez-García, A. et al. Iron fertilization of the Subantarctic Ocean during the last ice age. Science 343, 1347–1350 (2014).Article CAS Google Scholar
- 64.Jouzel, J. et al. Orbital and millennial Antarctic climate variability over the past 800,000 years. Science 317, 793–796 (2007).CAS Article Google Scholar
- 65.Parrenin, F. et al. The EDC3 chronology for the EPICA Dome C ice core. Clim. Past 3, 485–497 (2007).Article Google Scholar
- 66.McIntyre, A. The Coccolithophorida in Red Sea sediments. SpringerLink https://doi.org/10.1007/978-3-662-28603-6_29 (1969).
- 67.Gruetzner, J. et al. A new seismic stratigraphy in the Indian-Atlantic Ocean gateway resembles major paleo-oceanographic changes of the last 7 Ma. Geochem. Geophys. Geosyst. 20, 339–358 (2019).Article Google Scholar
- 68.Prahl, F. G. & Wakeham, S. G. Calibration of unsaturation patterns in long-chain ketone compositions for palaeotemperature assessment. Nature 330, 367–369 (1987).CAS Article Google Scholar
- 69.Andruleit H. A filtration technique for quantitative studies of coccoliths. Micropaleontol. https://www.jstor.org/stable/1485964 (1996).
- 70.Hammer Ø., Harper, D. A. T. & Ryan, P. D. PAST-PAlaeontological STatistics, v. 1.89 (2009).
- 71.Beaufort, L., de Garidel-Thoron, T., Mix, A. C. & Pisias, N. G. ENSO-like forcing on oceanic primary production during the Late Pleistocene. Science 293, 2440–2444 (2001).CAS Article Google Scholar
- 72.Torrence, C., Compo, G. P., Torrence, C. & Compo, G. P. A practical guide to wavelet analysis. Bull. Am. Meteorol. Soc. 79, 18 (1998).Article Google Scholar
- 73.Schulz, M. & Mudelsee, M. REDFIT: estimating red-noise spectra directly from unevenly spaced paleoclimatic time series. Comput. Geosci. 28, 421–426 (2002).Article Google Scholar
- 74.Luis, A. J. & Sudhakar, M. Upper-ocean hydrodynamics along meridional sections in the southwest Indian sector of the Southern Ocean during austral summer 2007. Polar Sci. 3, 13–30 (2009).Article Google Scholar
- 75.Beal, L. M., De Ruijter, W. P. M., Biastoch, A. & Zahn, R. 136 SWIWG. On the role of the Agulhas system in ocean circulation and climate. Nature 472, 429–436 (2011).CAS Article Google Scholar
- 76.Gregg, W. W. & Rousseaux, C. S. Decadal trends in global pelagic ocean chlorophyll: a new assessment integrating multiple satellites, in situ data, and models. J. Geophys. Res. Oceans 119, 5921–5933 (2014).Article Google Scholar
- 77.Lisiecki, L. E. & Raymo, M. E. A Pliocene-Pleistocene stack of 57 globally distributed benthic δ18O records. Paleoceanography https://doi.org/10.1029/2004pa001071 (2005).
- 78.Petit, J. R. et al. Climate and atmospheric history of the past 420,000 years from the Vostok ice core, Antarctica. Nature 399, 429–436 (2019).Article CAS Google Scholar
- 79.Stern, J. V. & Lisiecki, L. E. Termination 1 timing in radiocarbon‐dated regional benthic δ18O stacks. Paleoceanography 29, 1127–1142 (2014).Article Google Scholar
- 80.Landais, A. et al. Two-phase change in CO2, Antarctic temperature and global climate during Termination II. Nat. Geosci. 6, 1062–1065 (2013).CAS Article Google Scholar
Acknowledgements
This work used samples and data provided by the IODP. We are thankful for the support from the crew of the R/V JOIDES Resolution and IODP staff. This work is funded through the Universidad de Salamanca Postdoctoral Contract supported by the Ministerio de Ciencia, Innovación y Universidades Grant RTI2018-099489-B-I00 and the German Science Foundation (DFG) Research Center/Cluster of Excellence ‘The Ocean in the Earth System’ (MARUM; Grant No. 49926684). We acknowledge financial support from the National Science Foundation of the US under Award No. 1737218 (M.A.B), the European Union’s Horizon 2020 Research and Innovation Programme under the Marie Sklodowska Curie Grant Agreement No. 799531 (M.S.P.), and the Spanish Ministry of Science and Innovation Grant CTM2017-89711-C2-1-P, co-funded by the European Union through FEDER funds (F.J.J.E.).
This article appeared on the Nature website at https://www.nature.com/articles/s43247-021-00148-0
]]>