Uncovered: CO2 In Modern Ice Reaches 900 – 70,000 ppm – Wildly Incompatible With Atmospheric Levels
We know from 20th century observations that the snow that falls on the surface of polar climates can, within decades, be entombed far below the surface as compact glacial ice. For example, a plane that landed on the surface snow of the Greenland ice sheet in 1942 was recovered with more than 100 meters of ice accumulation piled atop it (AVweb, 2018).
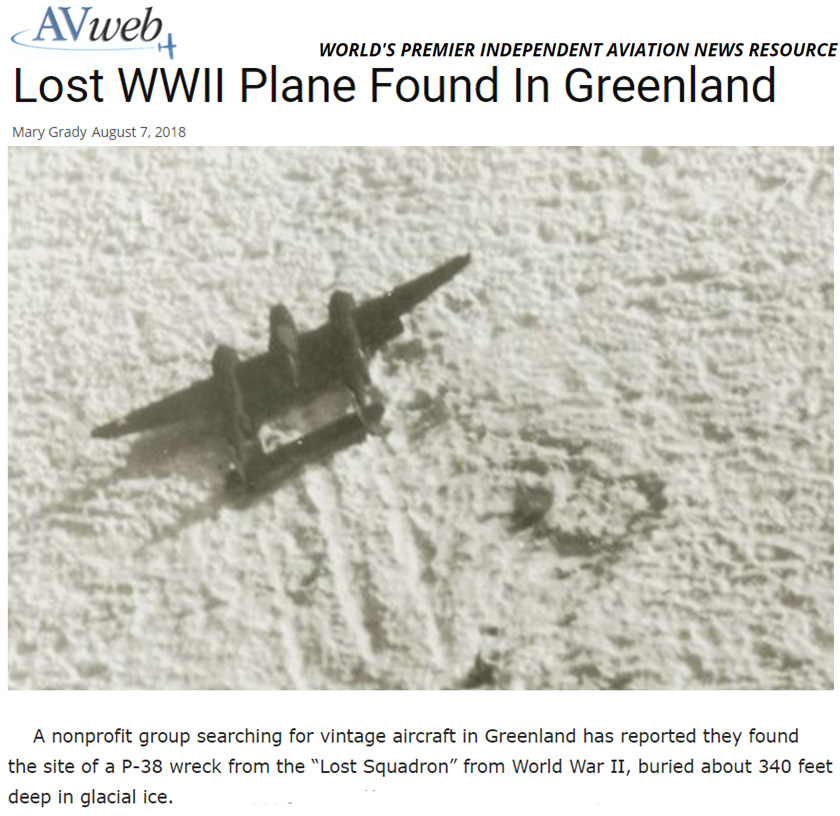
Image Source: AVweb, 2018
Since 1973, Barrow, Alaska has been one of the few sites on Earth where global atmospheric CO2 has been systematically monitored. In the last 50 years, CO2 has risen from about 325 ppm to today’s 415 ppm.
But the CO2 measurements in the Barrow snow (16 meters above the surface) show CO2 ranges from 800 to 2100 ppm (Coyne and Kelley, 1974) at this site. The CO2 levels in Barrow snow can even fluctuate by as much as 900 ppm in a span of 2 hours. Neither one of these conditions are compatible with what happens with atmospheric CO2 concentrations.
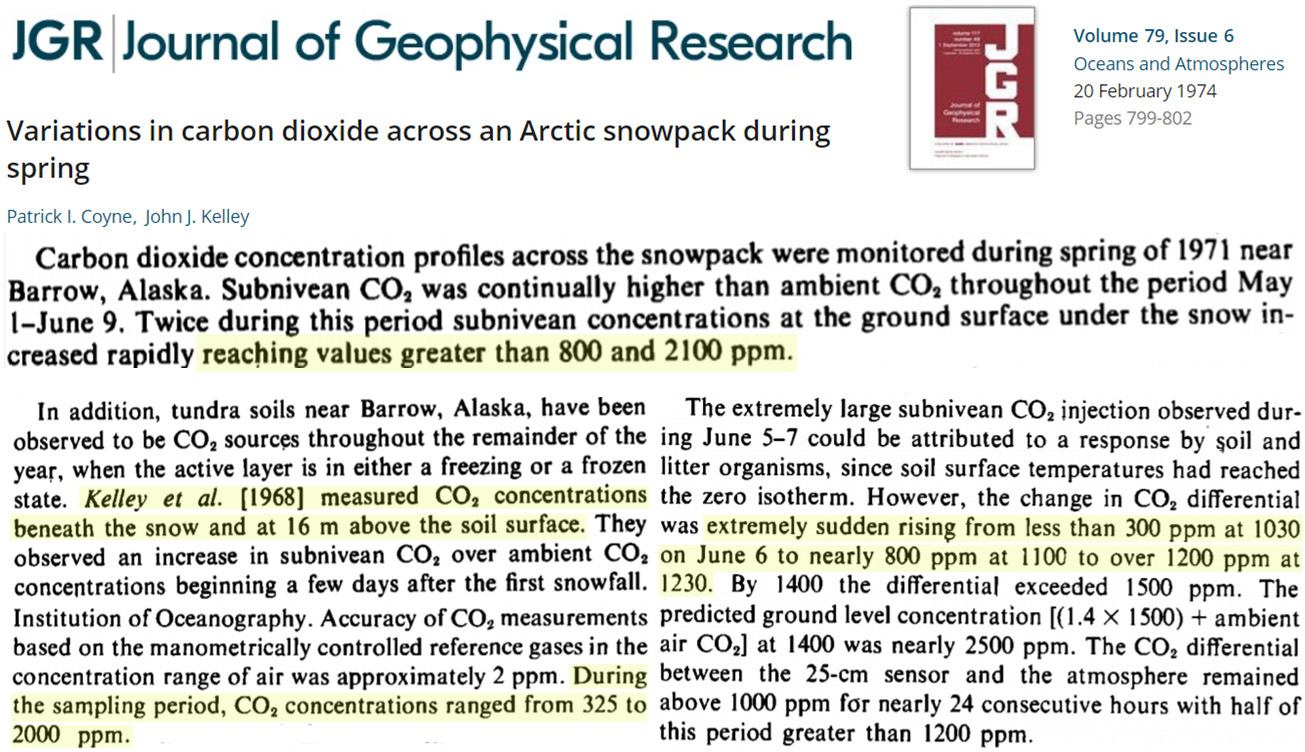
Image Source: Coyne and Kelley, 1974
Atmospheric CH4 (methane) concentrations are said to average 1.8 ppm today, more than double (0.7 ppm) what they were in the last century. In the High Arctic, however, CH4 levels reach 600 ppm and CO2 can be as high as 3,800 ppm in the surface snow, fluctuating by 100s of ppm within distances of centimeters (Pirk et al., 2016).
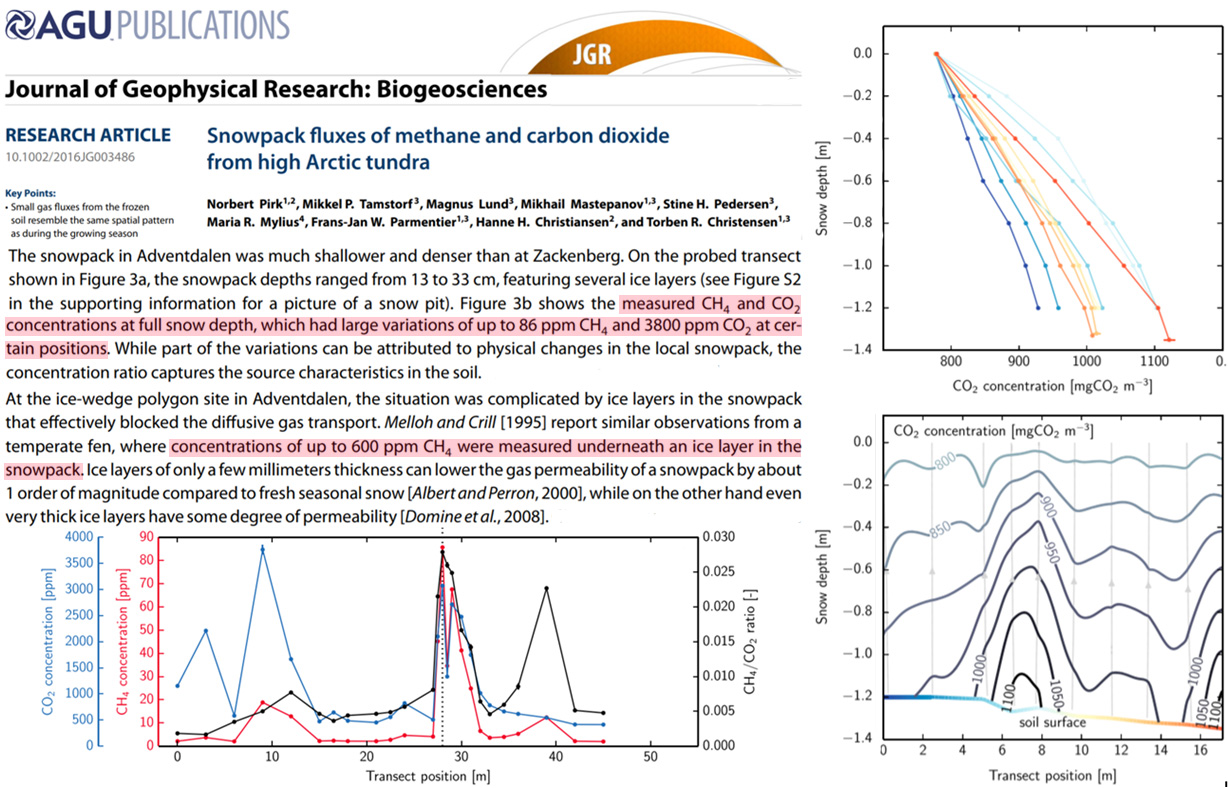
Image Source: Pirk et al., 2016
Seasonal snowpack exposed to meadow soil has CO2 concentrations fluctuating between 8,400 and 10,000 ppm from one year to the next in Colorado (Liptzin et al., 2009). CO2 ranges from 600 to 1,800 ppm in Wyoming, changing by 200 ppm at the same location within a matter of days (Massman and Frank, 2006).
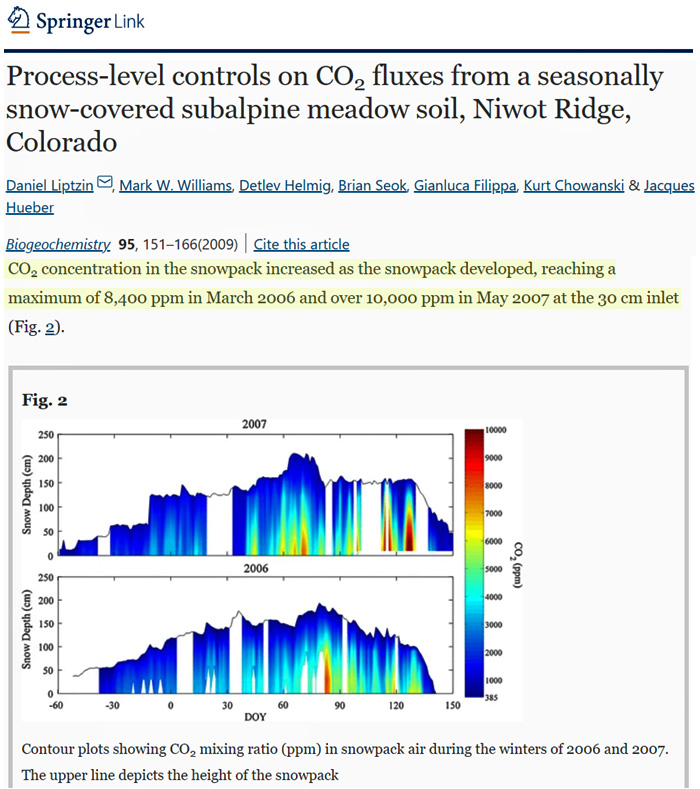
Image Source: Liptzin et al., 2009
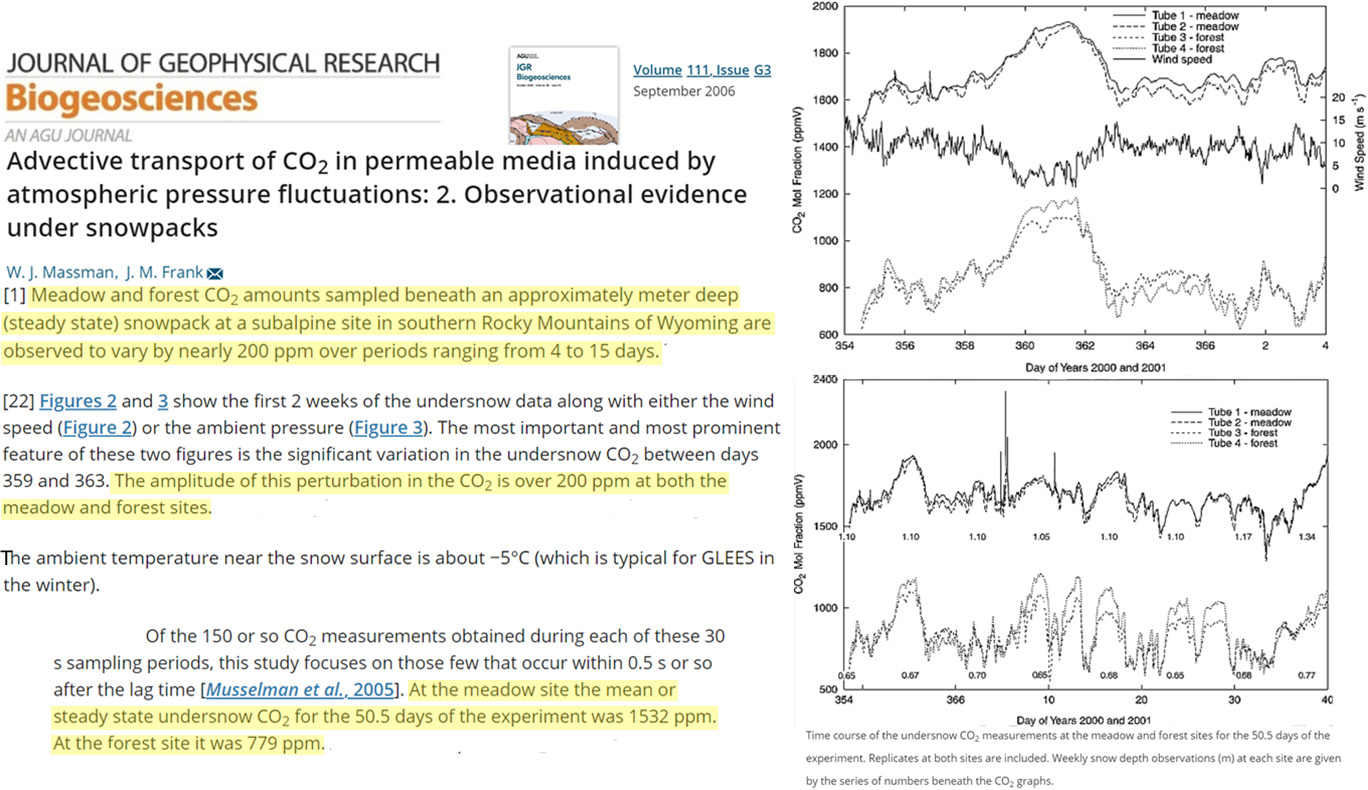
Image Source: Massman and Frank, 2006
At varied depths, Greenland ice has CO2 ranging from 357 to 641 at 20 meters and 243 to 436 ppm at 70 meters (Schwander et al., 1993).
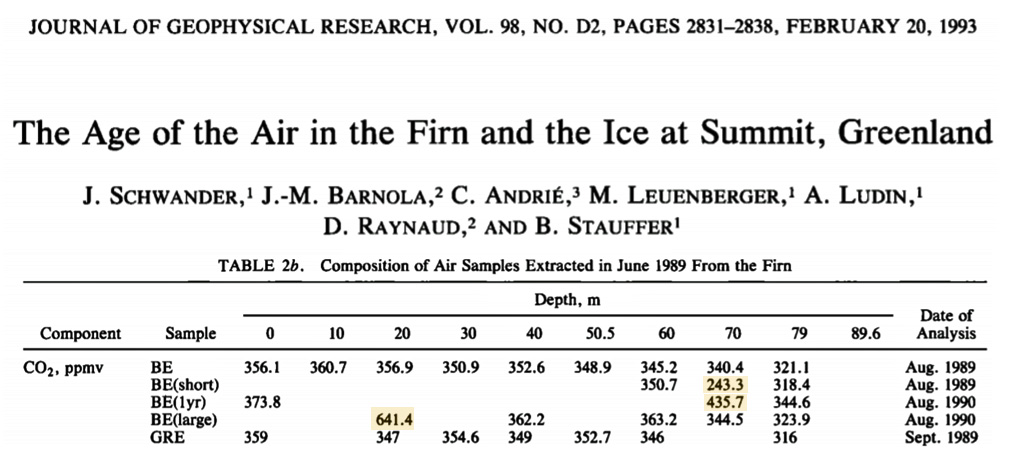
Image Source: Schwander et al., 1993
In other Greenland ice samples, differences in melt layer contributions allows CO2 to fluctuate between 300 and 684 ppm within a 0.39 m ice core, with the mean concentration 660 ppm (Stauffer et al., 1985).
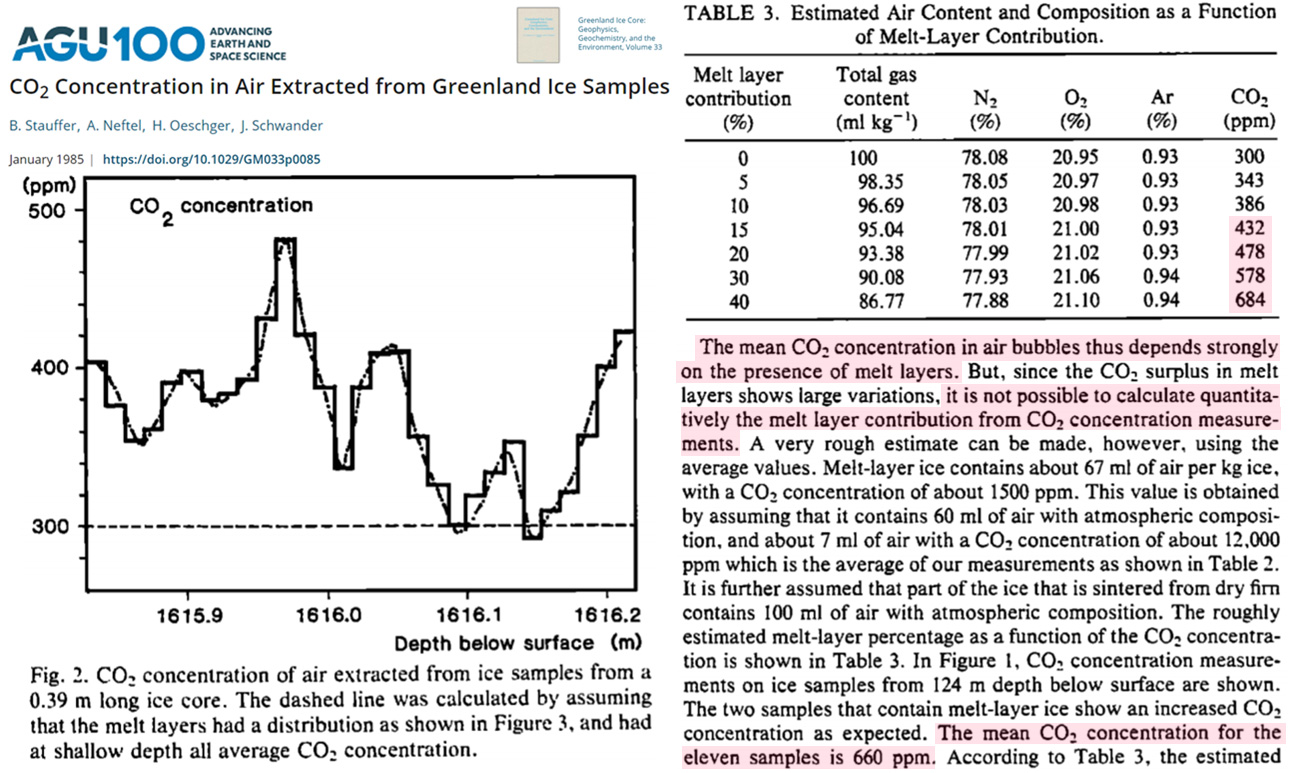
Image Source: Stauffer et al., 1985
CO2 in glacier ice from Norway has concentrations “three times those of air in the upper ice” (~850 to 1,100 ppm), with variations dependent on the sample locations (Coachman et al., 1958).
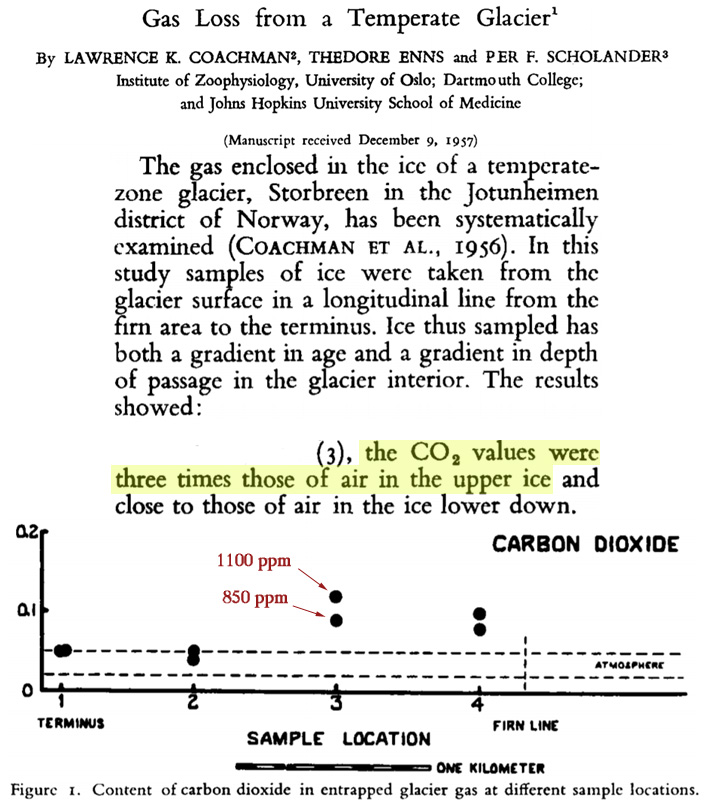
Image Source: Coachman et al., 1958
The “bubbles in Greenland icebergs” has CO2 readings of 1,500 to 2,100 ppm at some of the 25 assessed locations, then dipping to below 300 ppm at other sites (Scholander et al., 1961).
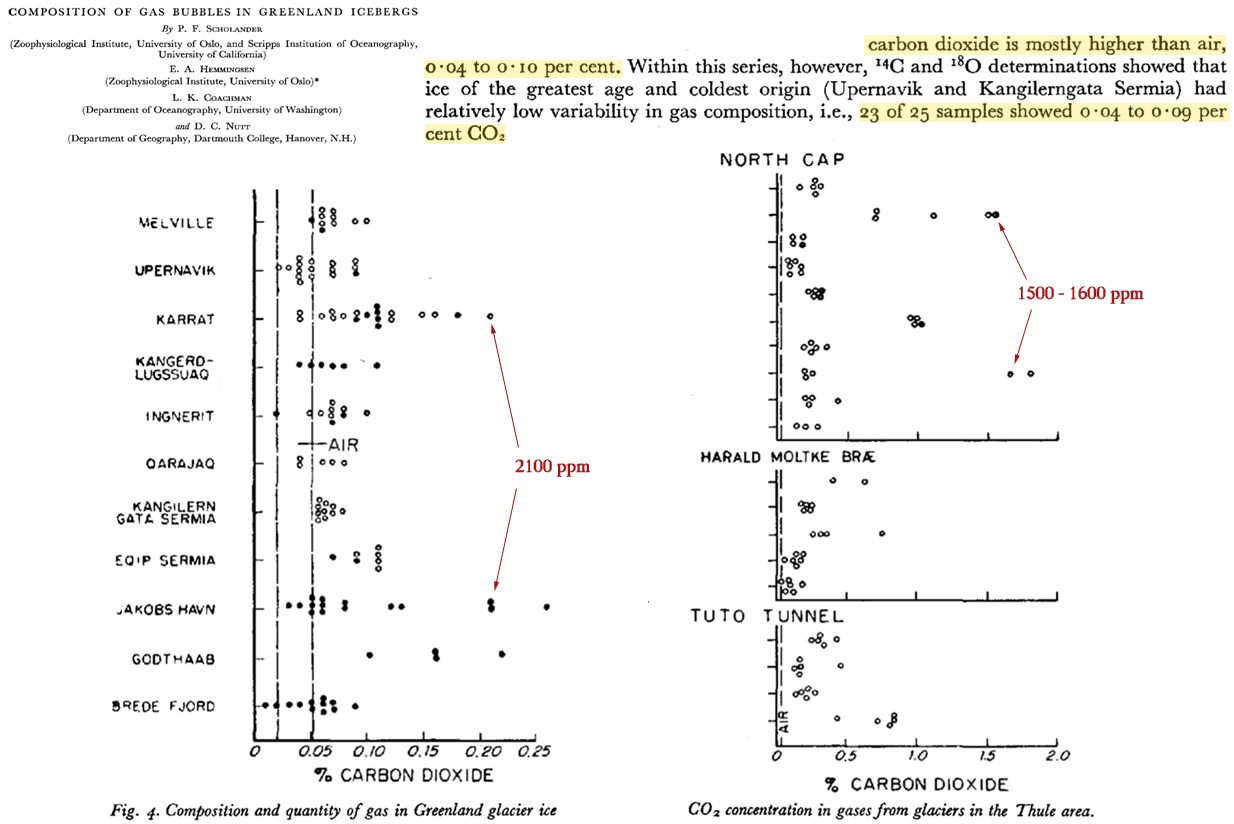
Image Source: Scholander et al., 1961
Glaciers in the Alps have atmospherically identical gas concentrations for N2, O2, and Ar (78%, 21%, and 09%, respectively), but the CO2 levels in alpine glacier ice is “approximately 50 times as great as in air” (Weiss et al., 1972). In fact, the CO2 concentrations ranged up to 18,200 and 70,100 ppm in some samples.
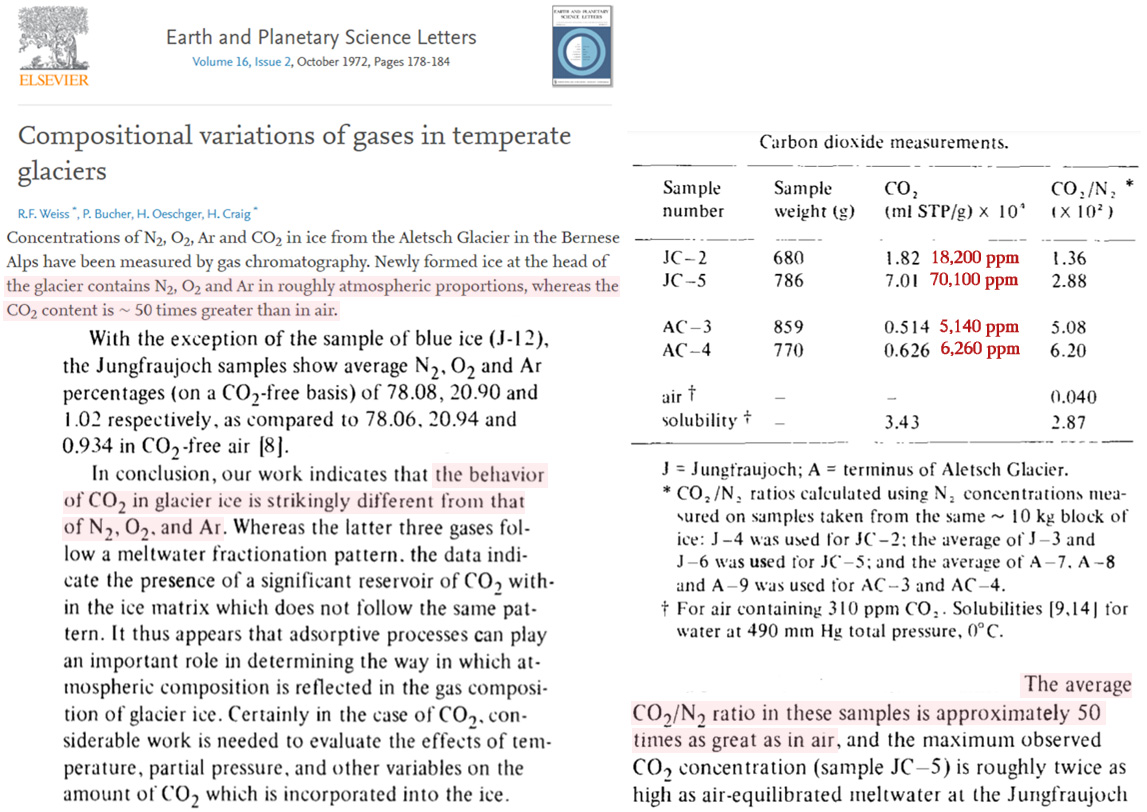
Image Source: Weiss et al., 1972
Antarctica is said to be the source of the most reliable and accurate ice core evidence for paleo CO2 measurements. And while the N2, O2, and Ar gas percentages are atmospherically consistent, the CO2 concentrations range from 840 to 2,900 ppm in modern Antarctic glaciers and icebergs (Matsuo and Miyake, 1966).
Worse, scientists report “the CO2 content in Greenland glacier ice is significantly higher (from 1.0 to 16.3%) than in Antarctic ice.” To clarify, that’s 10,000 to 163,000 ppm for CO2 measurements from Greenland ice.
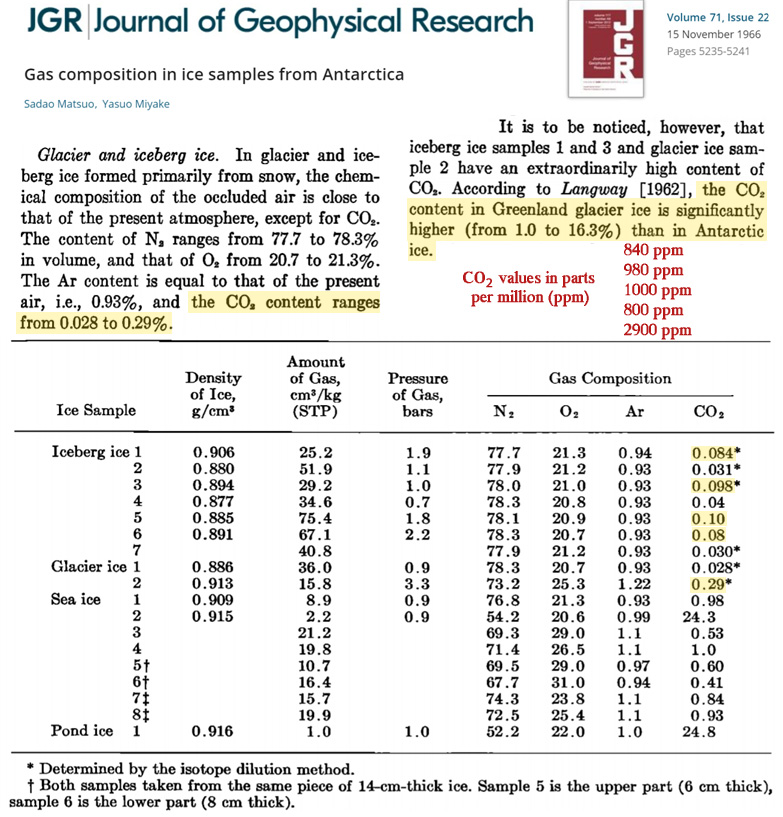
Image Source: Matsuo and Miyake, 1966
Another assessment comparing gas concentrations in Antarctic versus Greenland ice also unearthed massive discrepancies. Again, while N2, O2, and Ar percentages were atmospherically identical in both Greenland and Antarctic ice, CO2 was substantially different, with “the Camp Century value (0.35 percent) [3,500 ppm] being greater than that of the station Byrd (0.13 percent)” [1,300 ppm] (Demas, 1977).
Thousands of years old (Holocene) ice cores had CO2 values rising to levels of 5,500, 5,900, 6,700 ppm, and 7,400 ppm at Camp Century (Greenland).
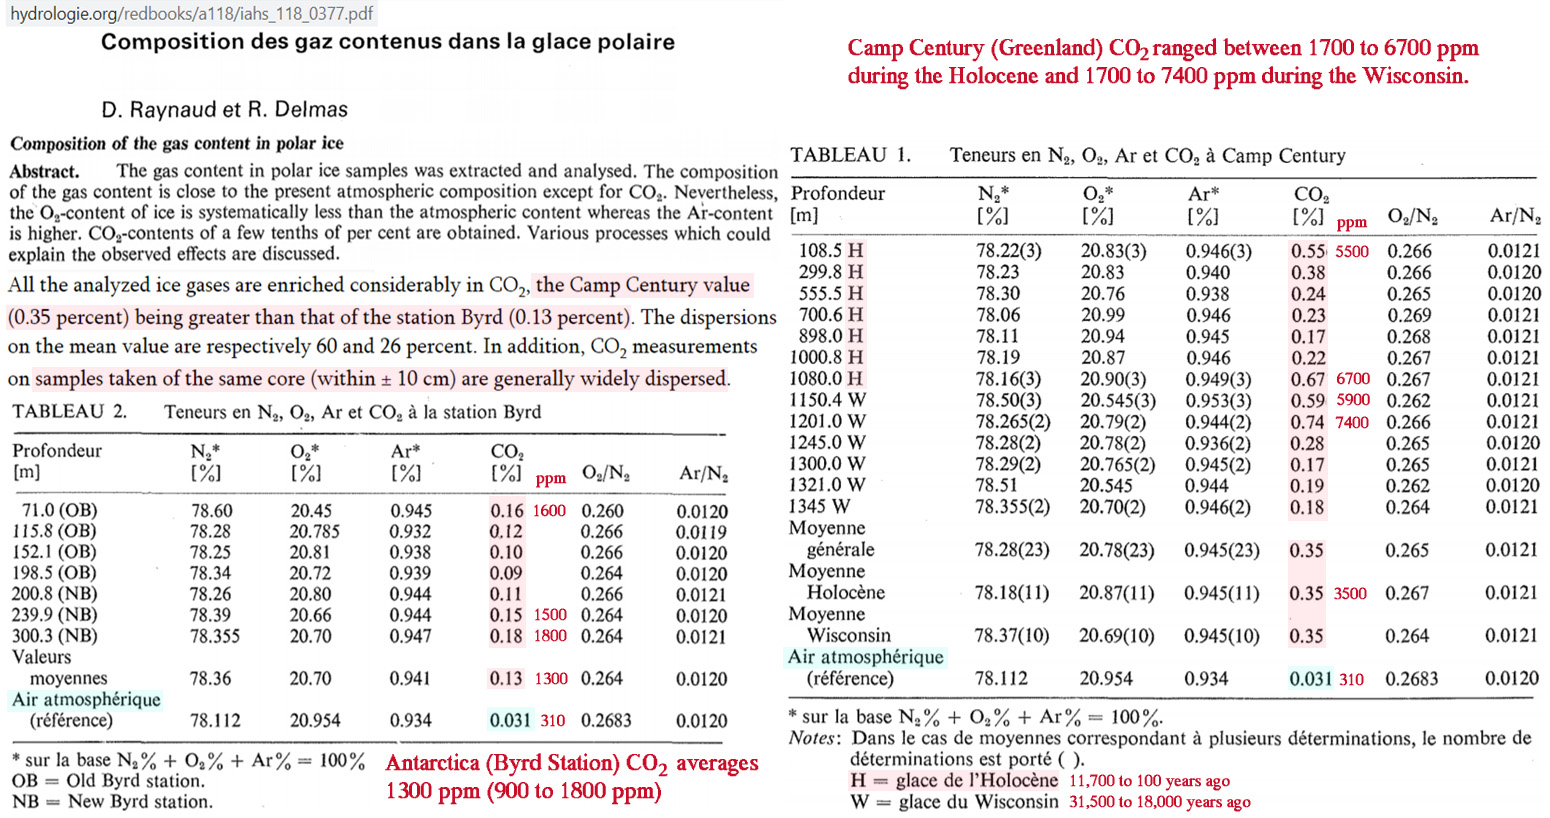
Image Source: Delmas, 1977
All these wildly disparate CO2 readings from modern and ancient ice at locations throughout the globe beg this question:
If the modern concentrations of CO2 measured in ice do not even remotely resemble the atmospheric concentrations of CO2, why is it assumed that thousands of years old ice accurately represents thousands of years old atmospheric CO2 concentrations?
This article appeared on the NoTricksZone website at https://notrickszone.com/2021/05/06/uncovered-co2-in-modern-ice-reaches-900-70000-ppm-wildly-incompatible-with-atmospheric-levels/
]]>