New Study Finds Robust Statistical Probability Temperature Drives CO2 Changes, Upending ‘Scientific Perception’
Prompted by the observation that dramatic COVID-related reductions in 2020 human CO2 emissions had zero impact on the Earth’s CO2 concentration, two scientists conduct extensive statistical probability analyses to conclude temperature changes lead CO2 changes, not the other way around.
The nearly global acceptance of economically-devastating lockdowns as a mitigating response to the COVID-19 pandemic has inspired many to question the assumption humans drive changes in CO2 concentration.
As Drs. Koutsoyiannis and Kundzewicz point out in their iconoclastic new study, “despite unprecedented decrease in carbon emission, there was an increase in atmospheric CO2 concentration, which followed a pattern similar to previous years.”
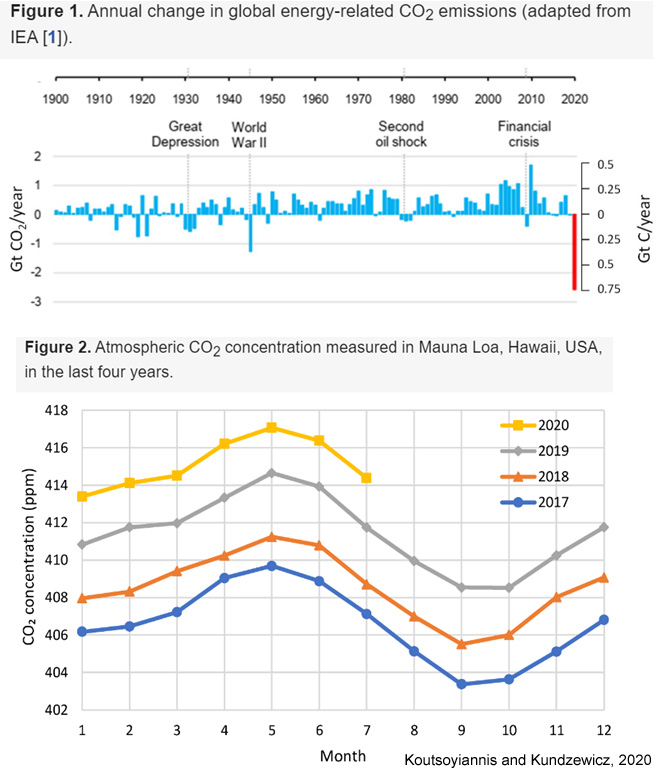
Image Source: Koutsoyiannis and Kundzewicz, 2020
Utilizing the obvious condition that causes precede effects, or that effects do not lead causes, the authors first point out that the paleoclimate record shows CO2 changes follow temperature changes by about 1000 years. Then they examine the sequential relationship between global temperature and atmospheric CO2 concentration during 1980–2019.
While they find the causality direction for CO2 leading temperature (T) changes does exist, the results of their study clearly “support the hypothesis that the dominant direction is T → CO2,” not CO2 → T.
In fact, the statistical probability is so robust “the p-values in the direction T → [CO2] are always smaller than in direction [CO2] → T by about 4 to 5 orders of magnitude, thus clearly supporting T → [CO2] as dominant direction.” Temperature is shown to lead CO2 changes by about 6 months to a year.
Drs. Koutsoyiannis and Kundzewicz acknowledge the perspective “CO2 → T prevails in public, as well as in scientific, perception.” So they point out that an IPCC analysis has natural ground (soil) CO2 emissions reaching 114 to 119 gigatons of carbon (GtC) per year, whereas ground (fossil fuel) emissions from anthropogenic sources only amount to 8 or 9 GtC per year. Consequently, the “change in carbon fluxes due to natural processes is likely to exceed the change due to anthropogenic CO2 emissions” as the “the intensity of biochemical process increases with temperature [and] leads to increasing natural CO2 emission.”
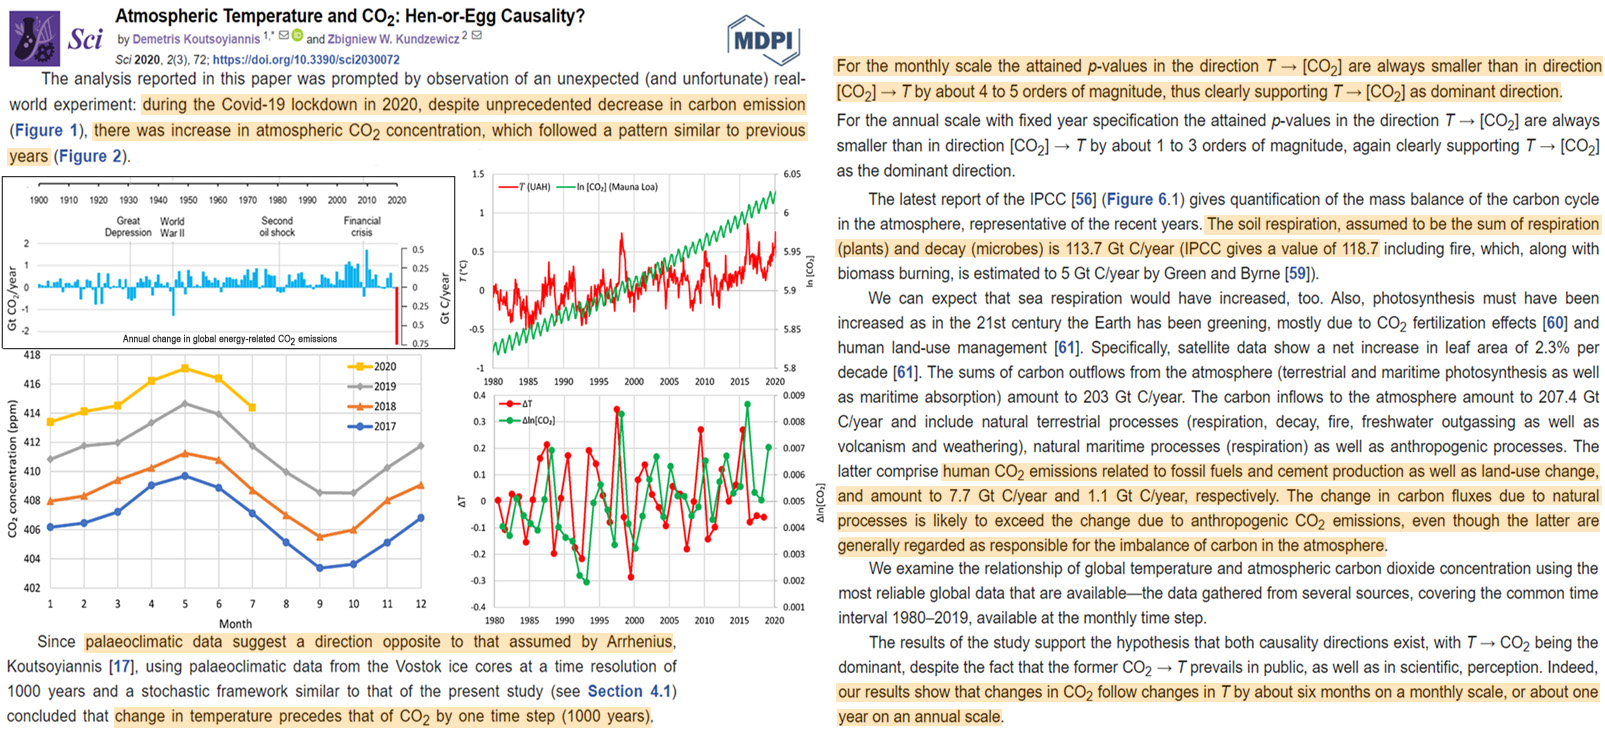
Image Source: Koutsoyiannis and Kundzewicz, 2020
This study is not without precedent. Another analysis of the temperature-CO2 phase relation for 1980-2012 (Humlum et al., 2013) indicated “changes in atmospheric CO2 are not tracking changes in human emissions” and “changes in global atmospheric CO2 are lagging 9.5-10 months behind changes in global air surface temperature.”
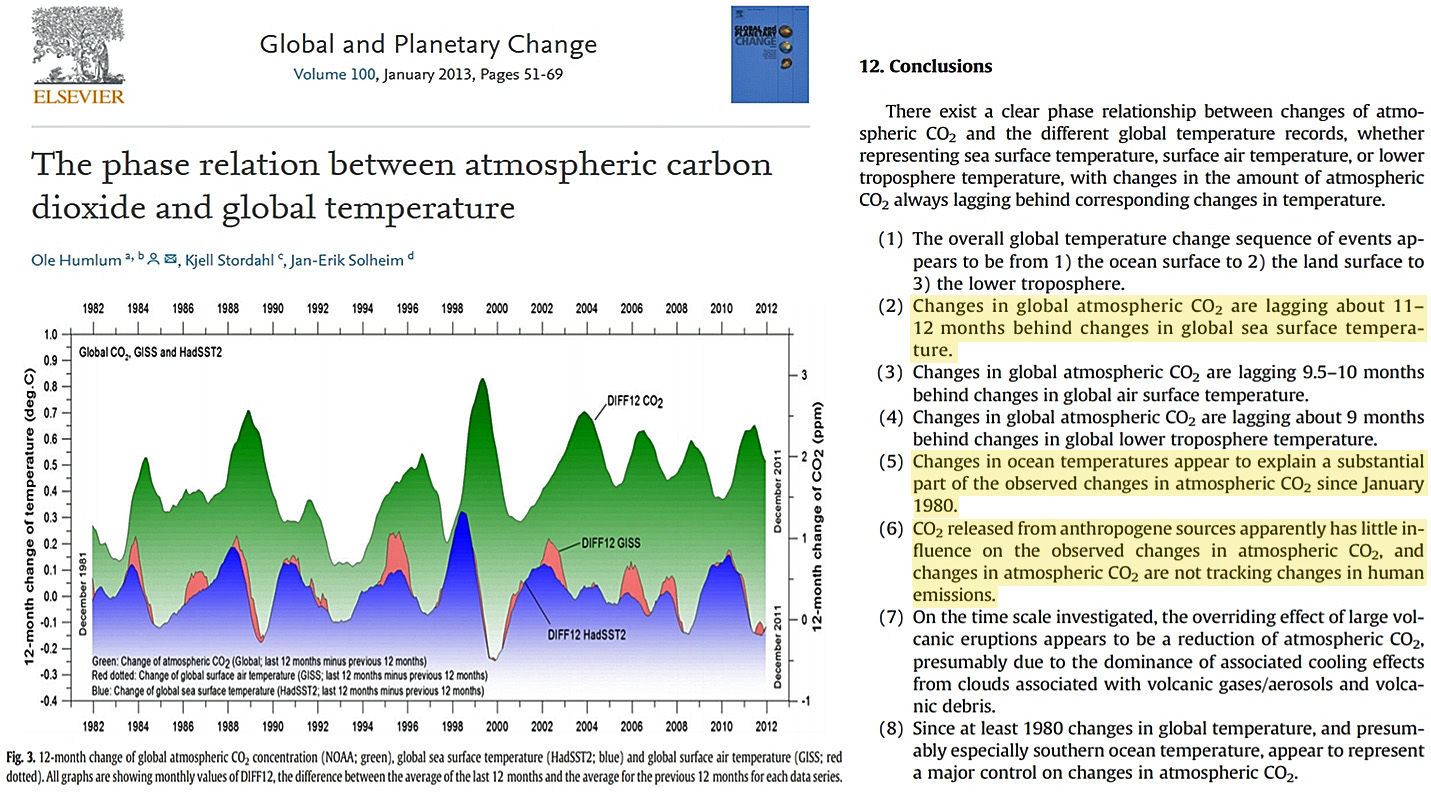
Image Source: Humlum et al., 2013
Atmospheric physicist Dr. Murry Salby authored a textbook highlighting the dependence of CO2 emissions on temperature. He insisted that “a significant portion” of the recent increase in CO2 “derives from a gradual increase in surface temperature” (pg. 253).
But there is also a “major inconsistency” in the currently accepted paleoclimate and straight-line (Mauna Loa) CO2 progressions, as they imply CO2 molecules do not respond to temperature like they are observed to do so chemically.
He concludes: “The two proxies of previous climate are incompatible. They cannot both be correct.”
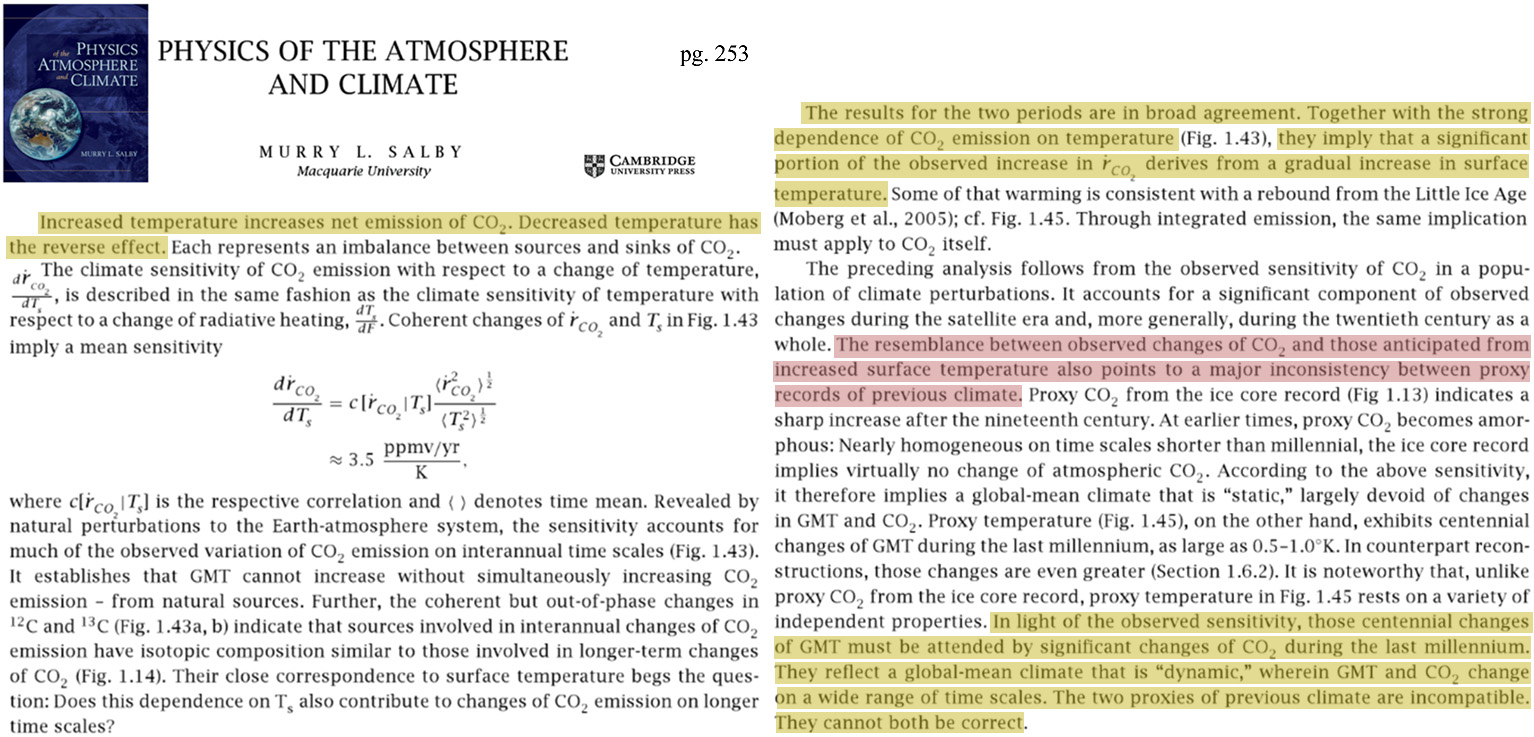
Image Source: Salby, 2012
A critical analysis of the paleoclimate CO2 record (Jaworowski et al., 1992) suggests the assumption we can accurately determine the entire Earth’s CO2 concentration by examining ancient polar ice bubbles – 36 to 100% of which are contaminated by exposure to today’s air – is “shown to be invalid.”
In Holocene-era ice cores, CO2 reaches 2500 ppm, 2900 ppm, even 7400 ppm per measurements taken in the 1960s, 1970s, and 1980s. These values were selectively rejected by those seeking to reach “consensus” that modern CO2 concentration values are unprecedented.
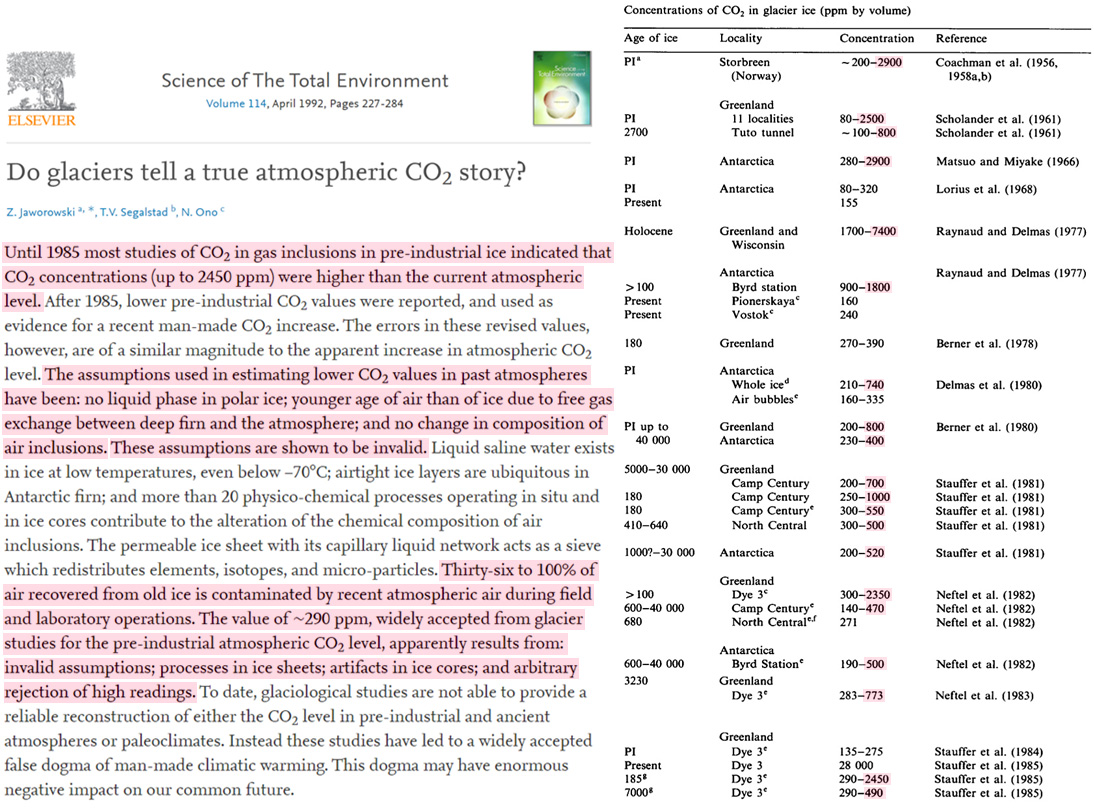
Image Source: Jaworowski et al., 1992
To further illustrate the currently accepted paleoclimate CO2 records are likely to be invalid, consider the fact that modern CO2 concentrations beneath snowpack in forests and meadows range from 600 to 1800 ppm and these concentrations can fluctuate by as much as 200 ppm within a period of just 4 days (Massman and Frank, 2006).
If this kind of flux can be observed for modern conditions, assessing the CO2 concentration beneath snowpack that is thousands of years old is little more than fanciful speculation.
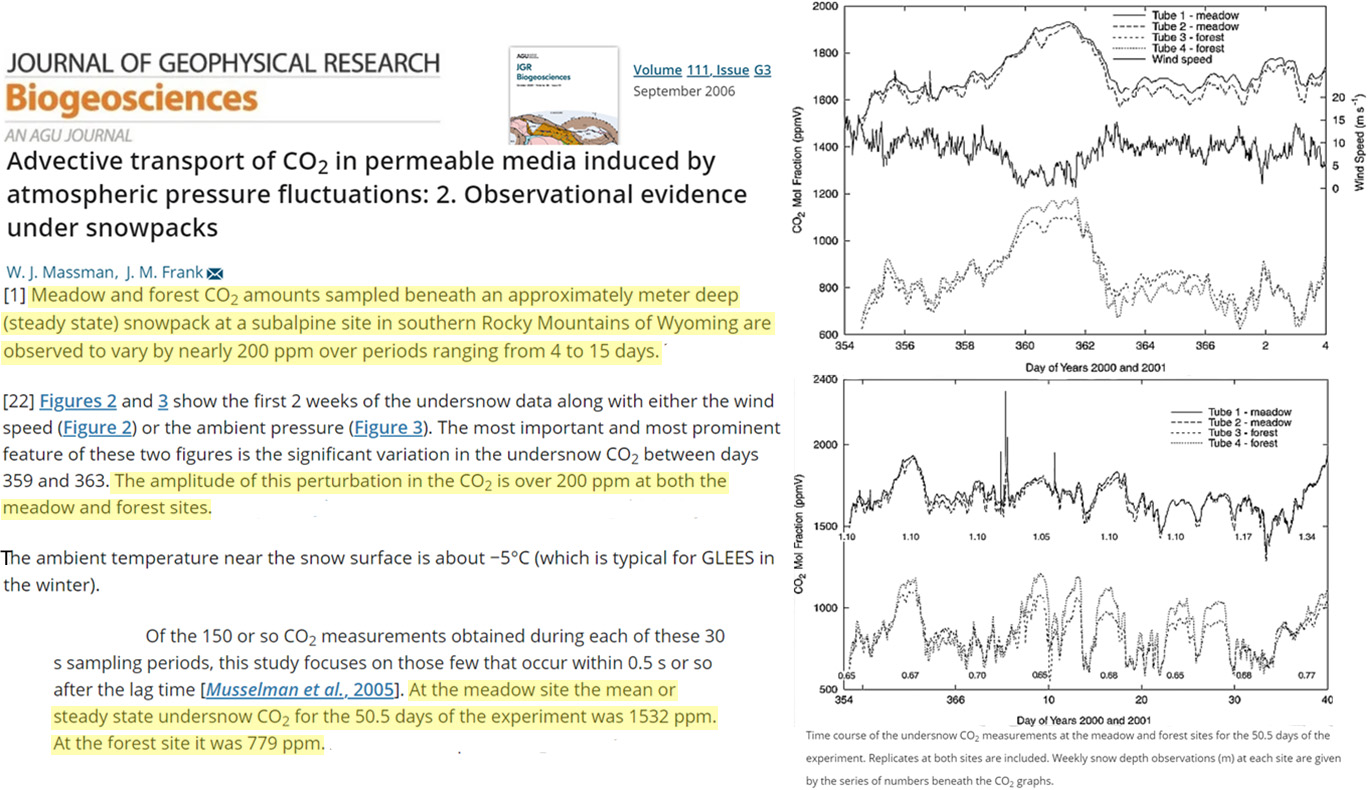
Image Source: Massman and Frank, 2006
This article appeared on the NoTricksZone website at https://notrickszone.com/2020/10/05/new-study-finds-robust-statistical-probability-temperature-drives-co2-changes-upending-scientific-perception/?utm_source=rss&utm_medium=rss&utm_campaign=new-study-finds-robust-statistical-probability-temperature-drives-co2-changes-upending-scientific-perception
]]>