12.10.2019
“No Significant Trend in U.S. Hurricanes Over the Period 1900–2017” (article review)
Editor Note: The 2019 Atlantic hurricane season was slightly above normal, with 18 named storms, 6 hurricanes, and 3 major (3-5 category) hurricanes versus norms of 12, 6 and 3 respectively, according to the National Oceanic and Atmospheric Administration. NOAA, however, noted that 2019 was “the fourth consecutive above-normal Atlantic hurricane season,” the last being 1998–2001.
But what about past hurricane activity? This recent article review at CO2 Science by Craig D. Idso (Ph.D.) follows.
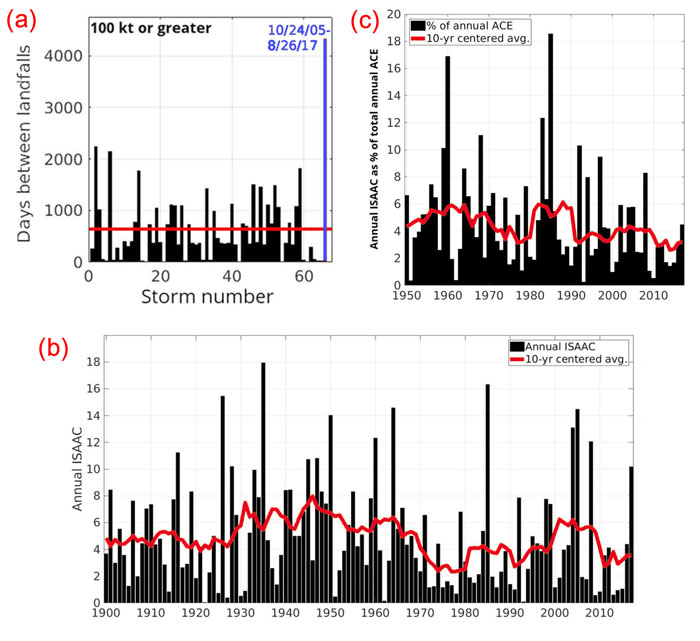
Truchelut, R.E. and Staehling, E.M. 2017. An energetic perspective on United States tropical cyclone landfall droughts. Geophysical Research Letters 44: 12,013-12,019. One of the more often cited claims of climate alarmists is that CO2-induced global warming is increasing both the frequency and magnitude of hurricane events. Rarely does a hurricane event occur these days without the media quoting someone who places blame for its existence on CO2 emissions. Fortunately, such assertions are false and easily refuted upon close examination of observational data, exposing the ignorance (or perhaps blatant disregard for the truth!) of the media and those they prop up to peddle such deception. We have posted numerous reviews of scientific papers on this topic over the past two decades proving this point which can be accessed by clicking on the many links accessible after clicking on the many sub headings under Hurricanes on this page. Our most recent addition to this archive covers the work of Truchelut and Staehling (2017). As their contribution, the two researchers introduced and examined an extended record of U.S. tropical cyclone activity based on accumulated cyclone energy (ACE, which accounts for hurricane intensity) over the period 1900 to 2017. Key findings of their study are presented in the three-panel graphic of Figure 1. Perhaps the most significant observation noted in their ACE times series of Figure 1b is the lack of any statistically significant trend across the 118 year record, albeit there are fluctuations on various time scales. Such absence of a long-term upward trend in the data is contrary to claims that rising levels of atmospheric carbon dioxide are causing more frequent or more severe storms. This point is further supported by the data presented in Figure 1a, which depicts the number of days between U.S. hurricane landfalls since 1900. As seen there, the average return period of major hurricanes with wind speeds of 100 kt or greater (i.e, Category 3) is approximately 700 days. Interestingly, prior to the passing of Hurricane Harvey in 2017, there was a record 4,324 days where no Category 3 or higher hurricane made landfall in the U.S., which time period the authors say “is almost double the length of the next-longest gap in major hurricane landfalls.” Thus, if anything, these data suggest that CO2-induced global warming is reducing the number and strength of landfalling U.S. hurricanes. In one final data demonstration to show that the climate alarmists have got it wrong (and possibly backwards), Truchelut and Staehling prepared a plot of the percent of each Atlantic hurricane season’s observed basin-wide ACE that occurred over or within a 0.5° buffer of the continental U.S. over the period 1950-2017. Analysis of these data revealed that “the 2006-2015 average is the lowest on record, with just under 3% of the total ACE in the period occurring over the continental U.S.” Such drought of hurricane activity in later years contributed to an overall downward trend in the record that the authors report was statistically significant at the 99% confidence level. Clearly, based on the data presented in this paper, there is no evidence to support the contention that rising levels of atmospheric CO2 are increasing the frequency or magnitude of hurricanes hitting the U.S. If anything, the data suggest rising CO2 is reducing them. So, the next time you hear someone claim a U.S. hurricane is caused by CO2-induced global warming, be sure to show them the data and teach them that is incorrect.